
📈 Charting Basics
CHAPTER 1: WHAT A CHART IS
A chart shows how price changes over time.
Every point on the chart represents transactions between buyers and sellers.
When you see price moving, it means:
Buyers are willing to pay more → price moves higher
Sellers are accepting less → price moves lower
Understanding the Axes
Vertical axis (price): the value of the stock
→ Higher on the chart = higher price
→ Lower on the chart = lower price
Horizontal axis (time): when those transactions happened
→ Left = past
→ Right = most recent price
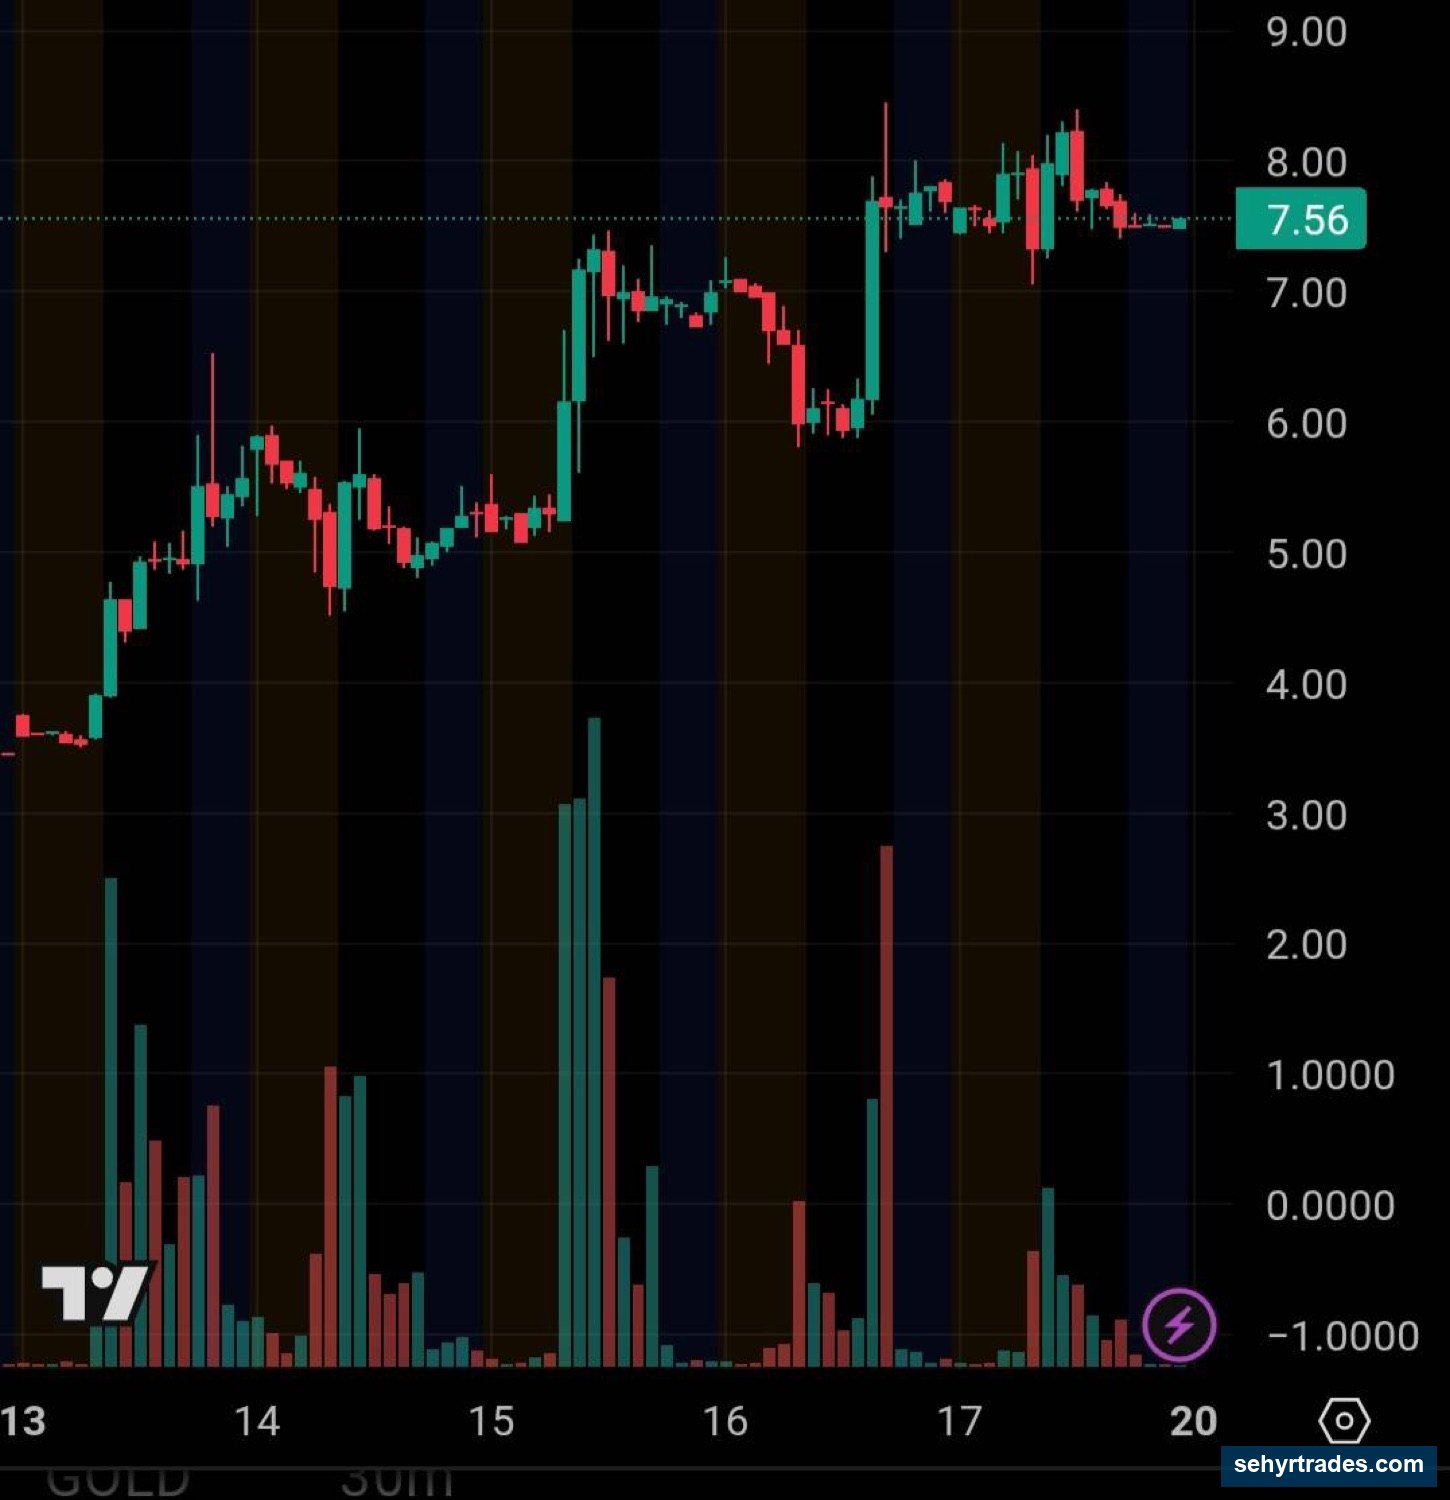
📊 Image: Candlestick Chart with Axes
What to notice:
Each candle represents price movement during a set period of time (in this case the x axis is days).
The chart moves left to right as time passes.
Price moves up and down based on buying and selling.
What You’re Actually Looking At
This is not just “a line going up or down.”
You are looking at:
Where buyers were aggressive
Where sellers pushed price down
Where price paused or reversed
A chart is a record of behavior.
Why This Matters
If you understand this, everything else makes more sense:
Trends = consistent buying or selling
Pullbacks = temporary shifts in that behavior
Setups = repeatable patterns in how people react
Next: Chapter 2 — Candlesticks
CHAPTER 2: CANDLESTICKS (How Price Is Displayed)
What is a candlestick?
A candlestick shows how price moved during a specific period of time.
Each candle represents:
Open
High
Low
Close
The timeframe you are on determines how long that period is.
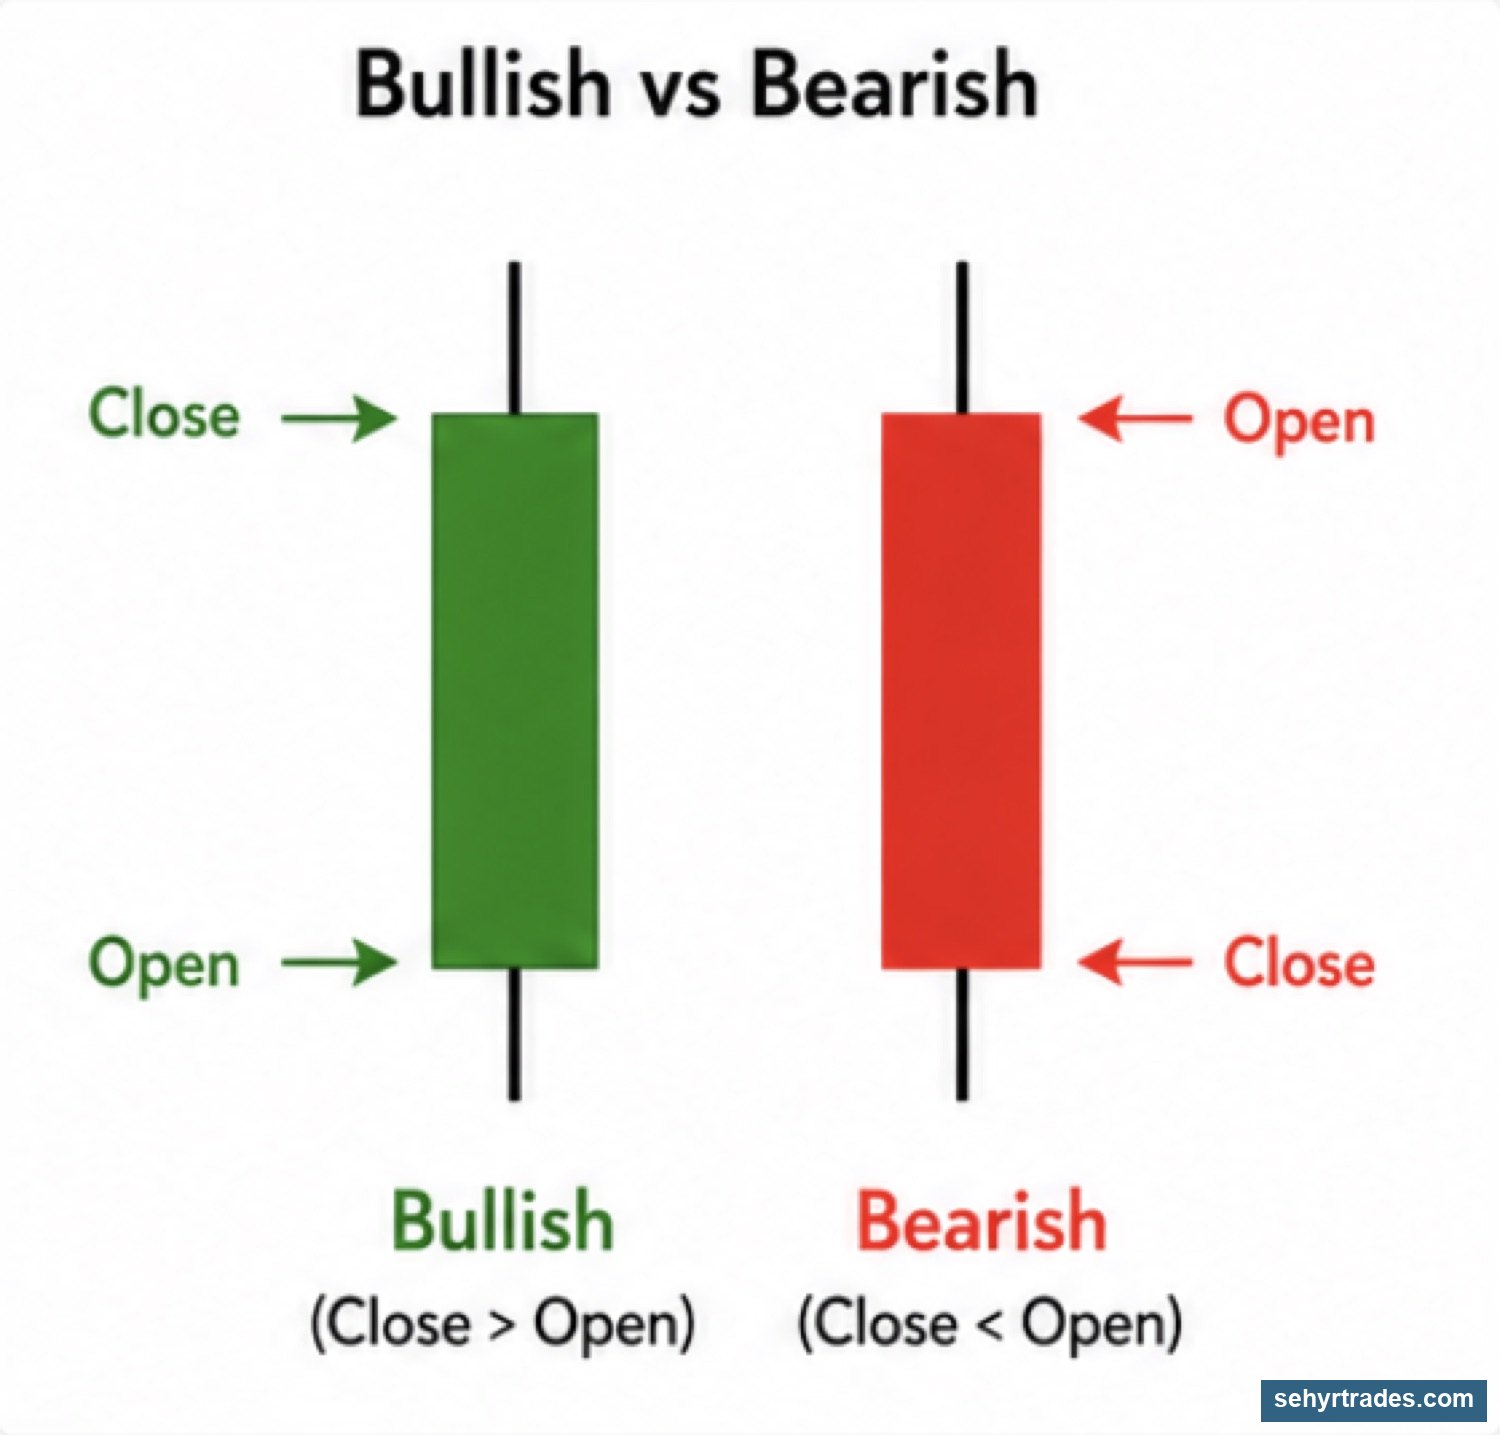
Bullish vs Bearish candles
Bullish candle (green):
Price closed higher than it opened
Buyers were in control
Bearish candle (red)
Price closed lower than it opened
Sellers were in control
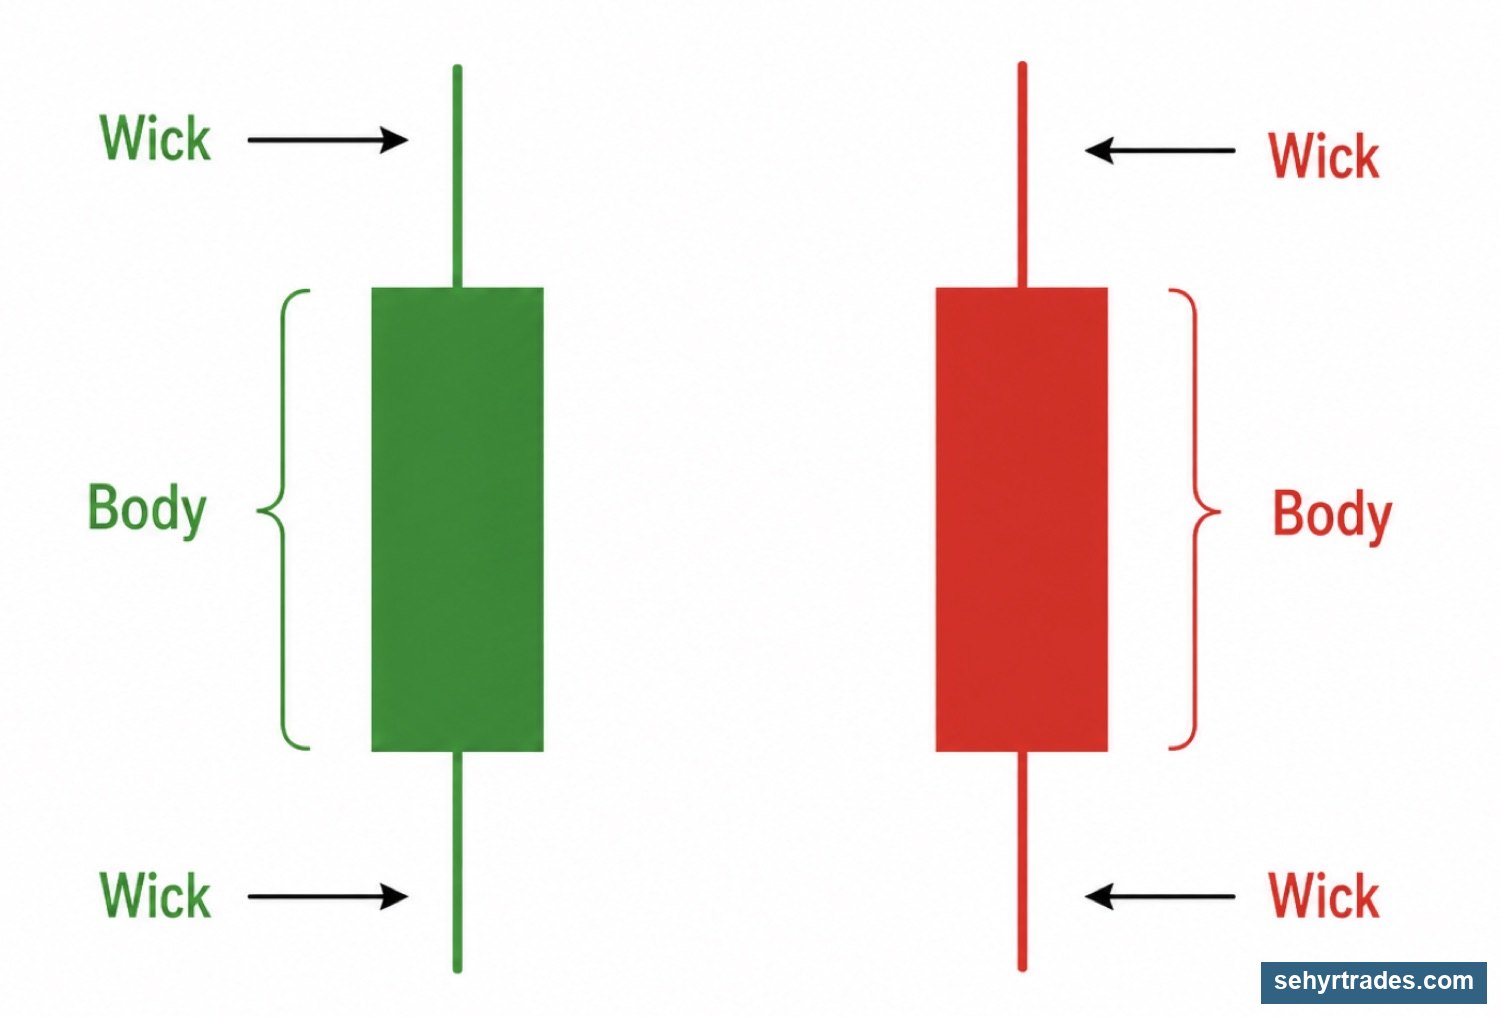
Parts of a candlestick
Body:
The space between the open and close
Shows where price started and finished
Wicks (or shadows):
The lines above and below the body
Show how far price moved before pulling back
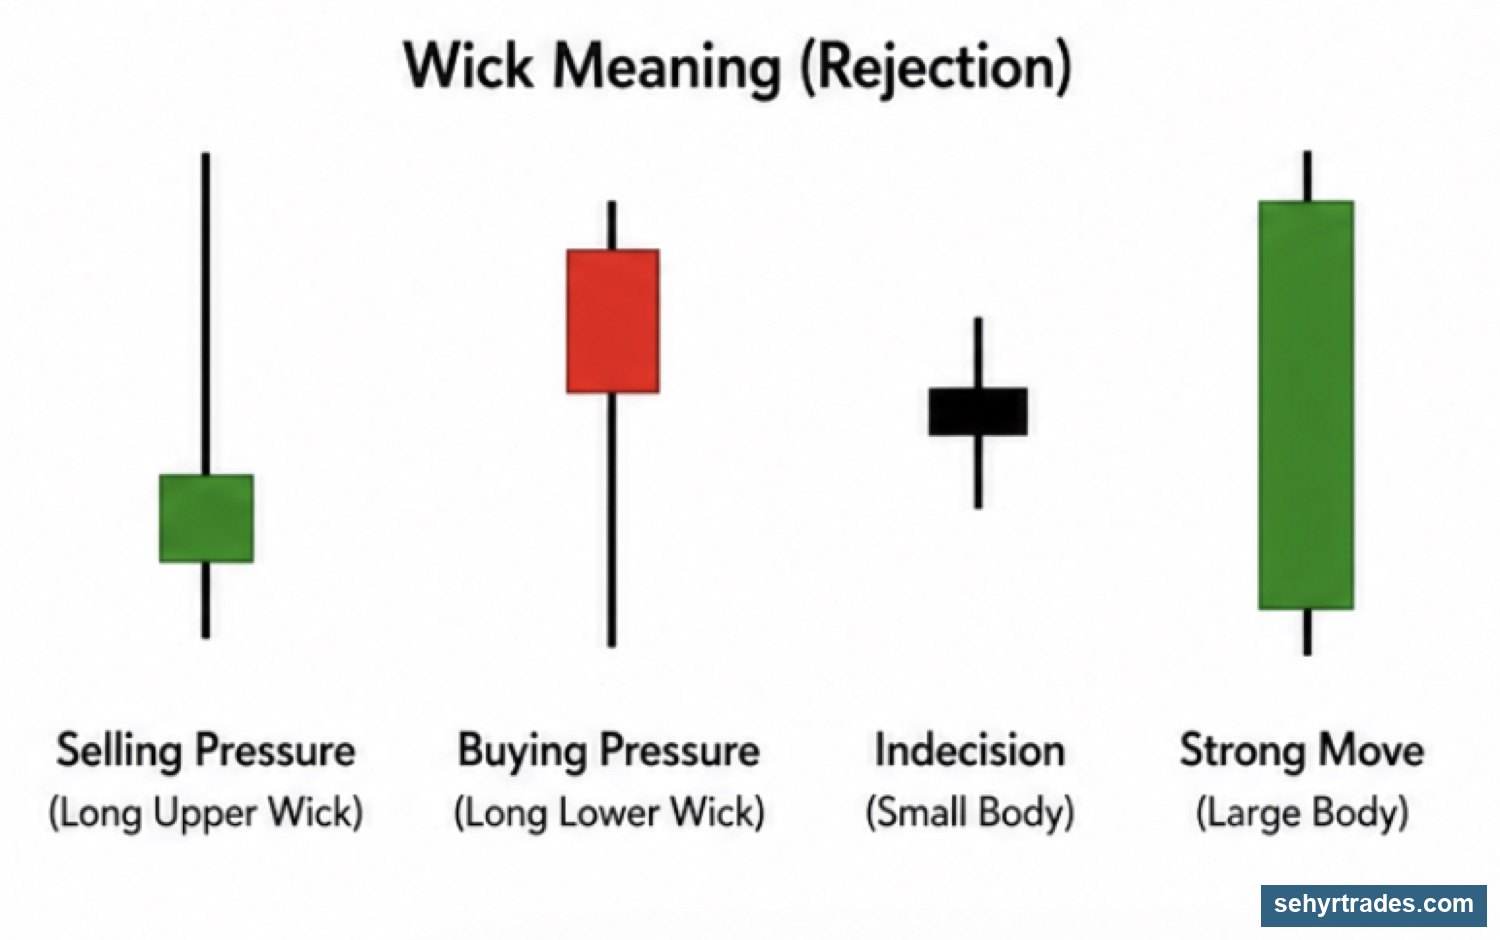
What candles actually tell you
Candles are not just shapes — they show behavior.
Large bodies:
- Strong movement
- Clear control (buyers or sellers)
Small bodies:
- Weak movement
- Indecision
Long upper wick:
- Price tried to go higher and failed
- Selling pressure
Long lower wick:
- Price dropped and was bought back up
- Buying pressure
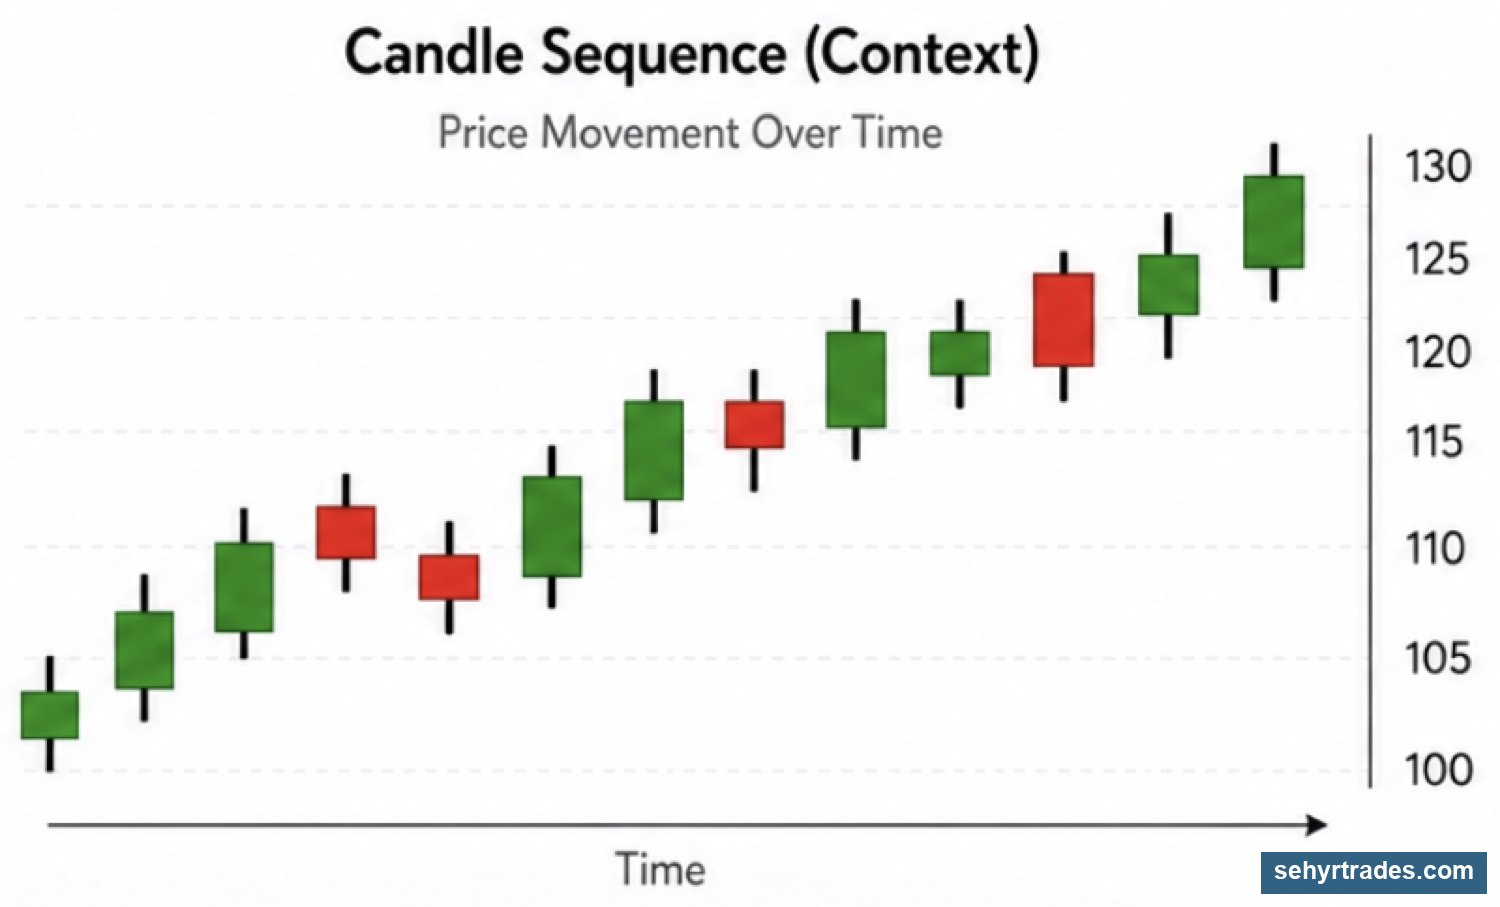
Reading candles in context
A single candle doesn’t mean much by itself.
You should always look at:
- What came before
- Where it is on the chart (support/resistance)
- The overall trend
CHAPTER 3: TIMEFRAMES (Same Stock, Different Story)
What is a timeframe?
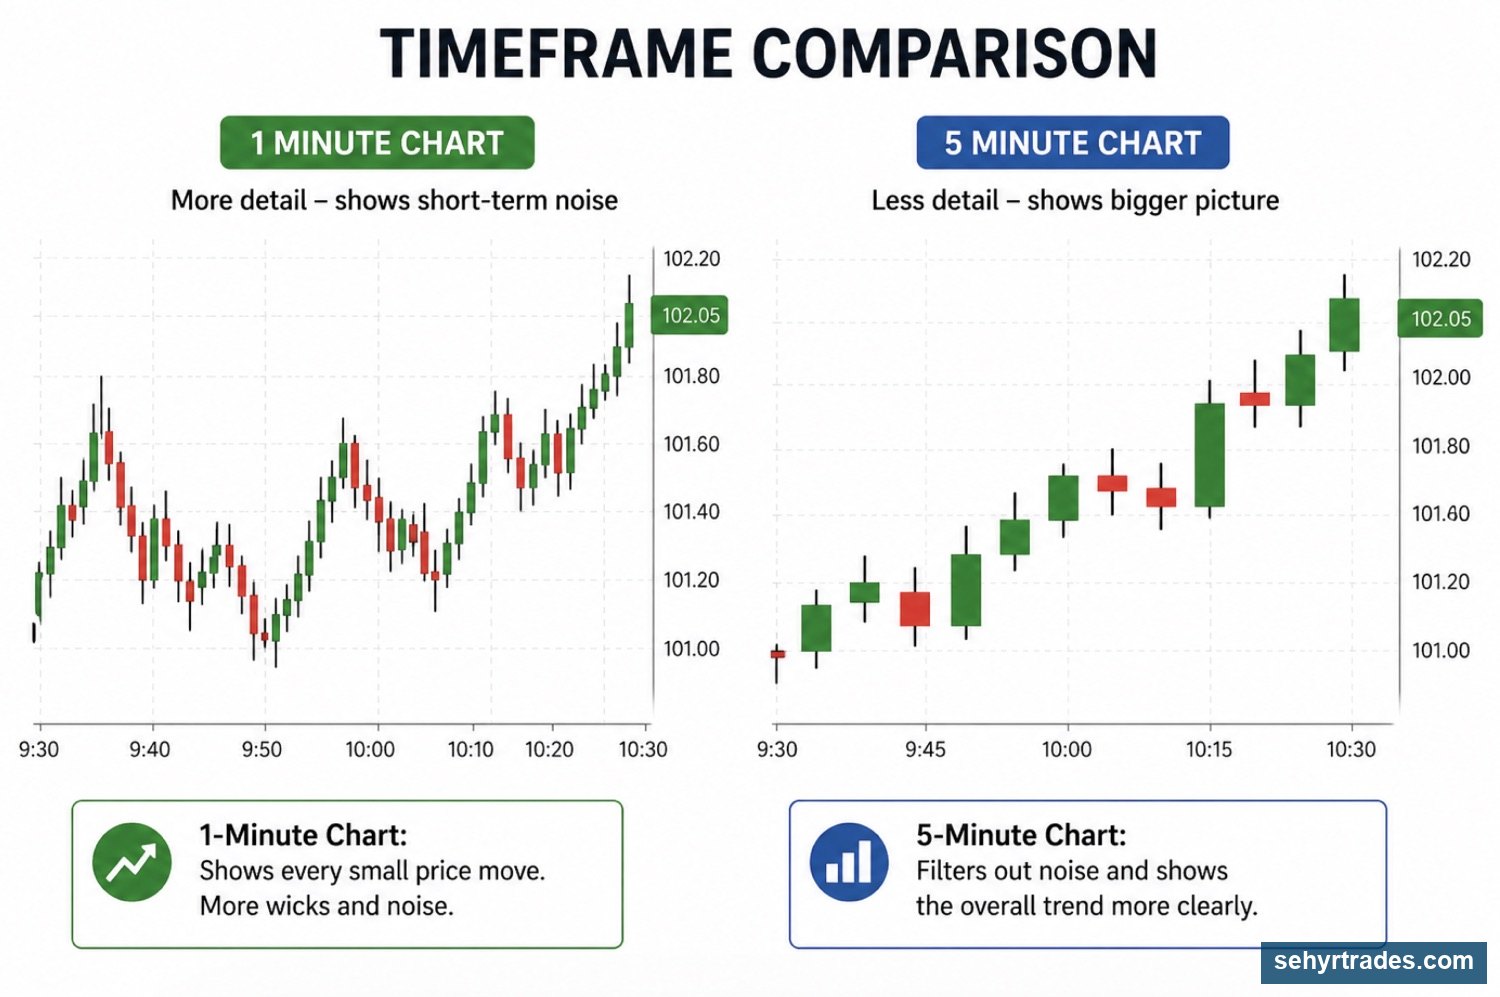
A timeframe shows how much time each candlestick represents.
Changing the timeframe changes how you see price.
On a larger time frame as below, one 5 minute candle would represent 5 individual 1 minute candles.
.
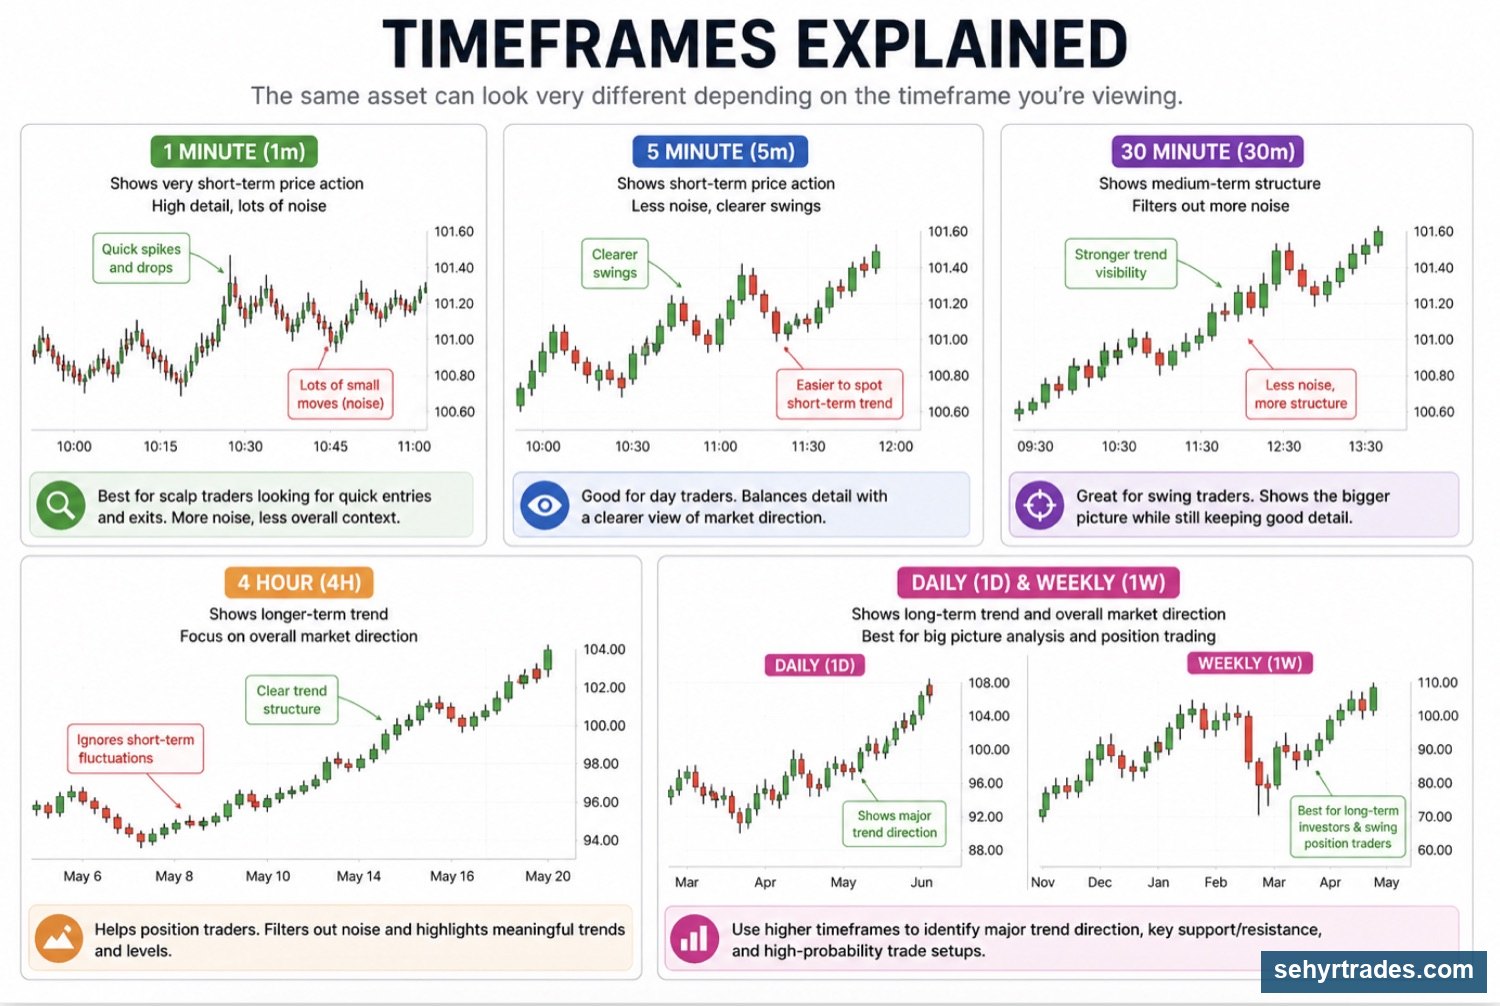
Common timeframes
Lower timeframes:
- 1 minute (1m)
- 2 minute (2m)
- 5 minute (5m)
Used for:
- entries
- fast moves
- short-term decisions
Mid timeframes:
- 15 minute (15m)
- 30 minute (30m)
Used for:
- intraday structure
- identifying direction during the day
Higher timeframes:
- 1 hour (1h)
- 4 hour (4h)
- Daily
- Weekly
Used for:
- overall trend
- bigger picture direction
Same stock, different story
The same stock can look completely different depending on the timeframe.
Lower timeframe → noisy, fast, detailed
Higher timeframe → smoother, clearer
Why timeframes matter
Timeframes help you understand:
Direction → where price is going
Structure → how price is moving
Timing → when to enter
How timeframes work together
You should not rely on only one timeframe.
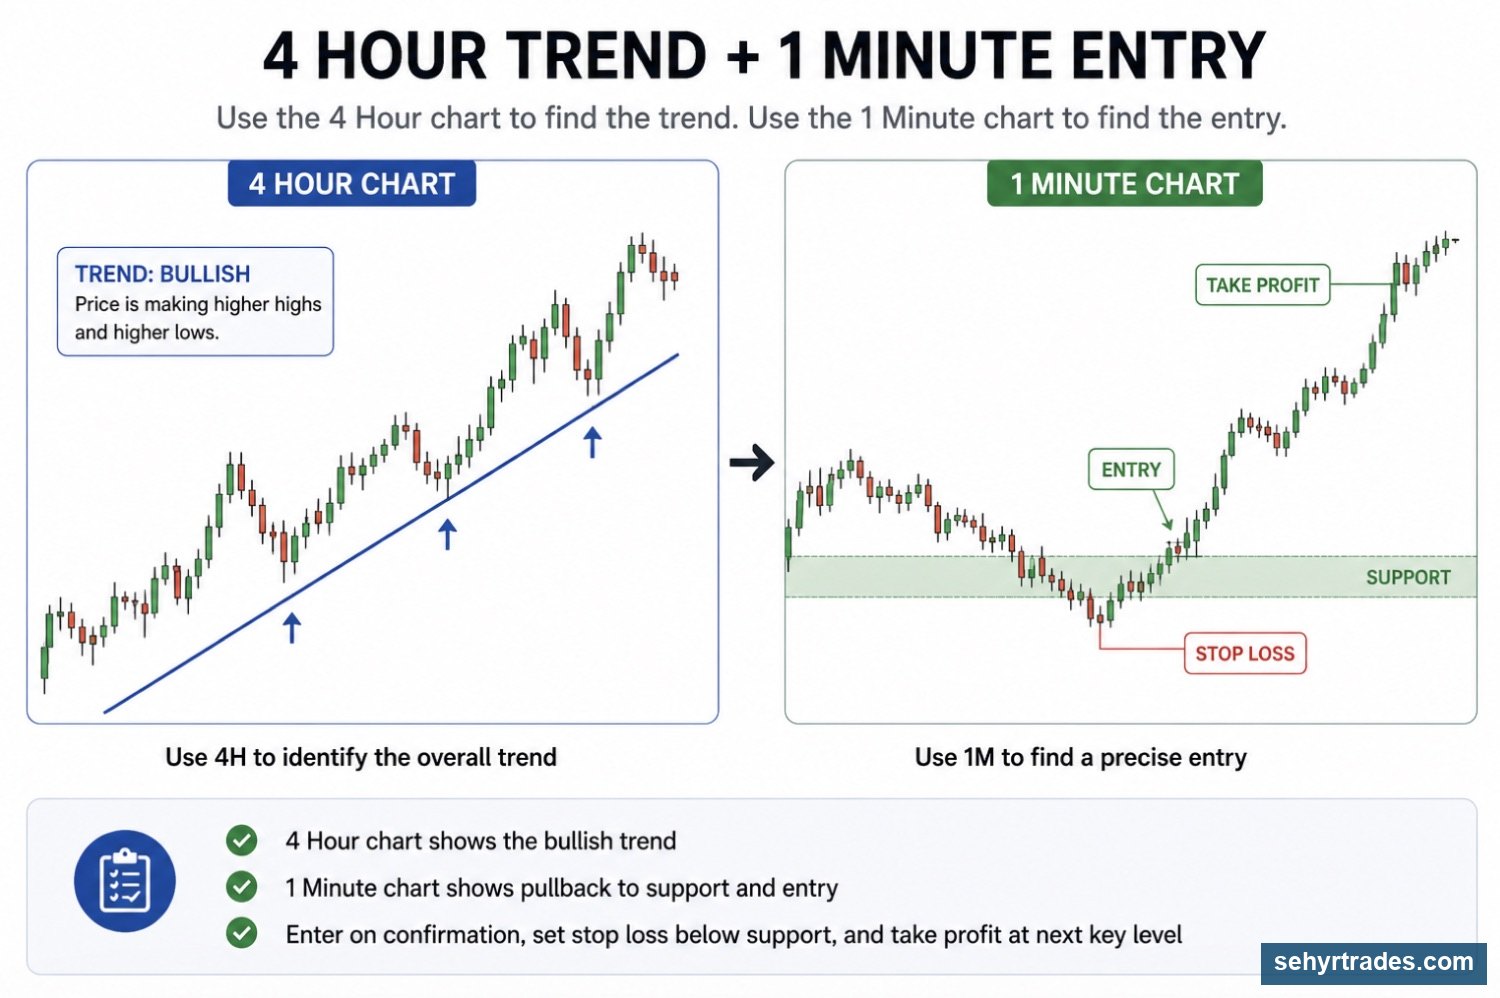
You combine them:
Higher timeframe → gives direction
Lower timeframe → gives entry
For example:
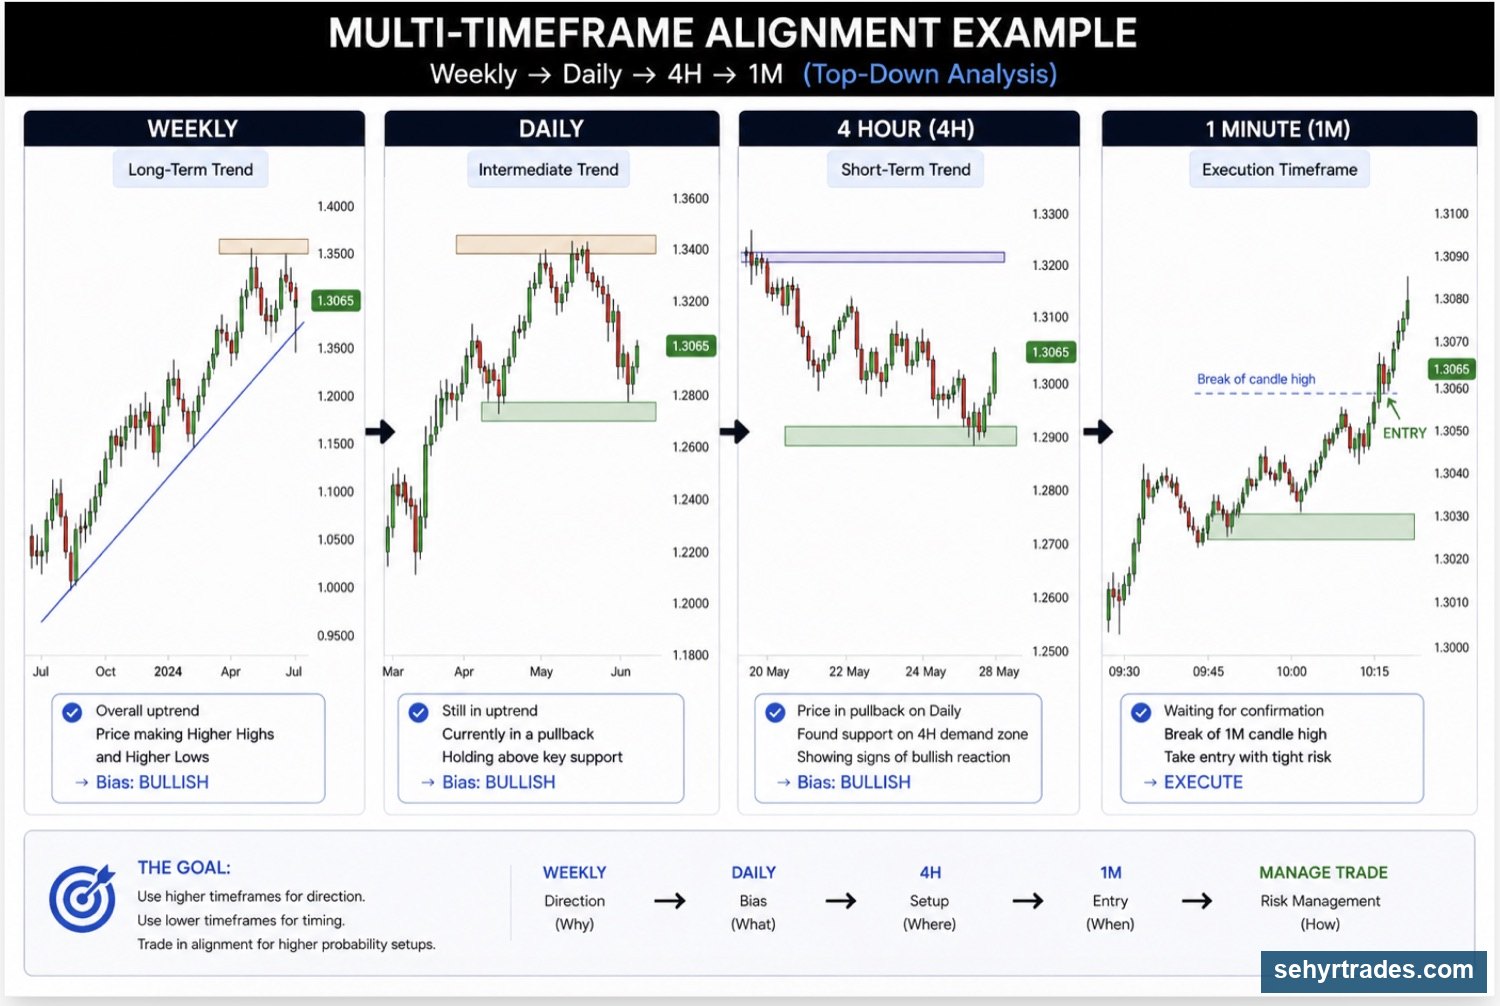
Multi-timeframe alignment (the basis of our trading strategy)
When multiple timeframes show the same direction:
👉 The setup is stronger. You can use this concept for BOTH day trading and swing trading.
Daily → uptrend
4h → uptrend
1h → pulling back and turning up
1 minute -> entry
This is a much safer way to trade and how we'll be trading in this discord.
Now let's talk about trends and what it means for a stock to be in an "uptrend".
Chapter 4: Trend & Structure
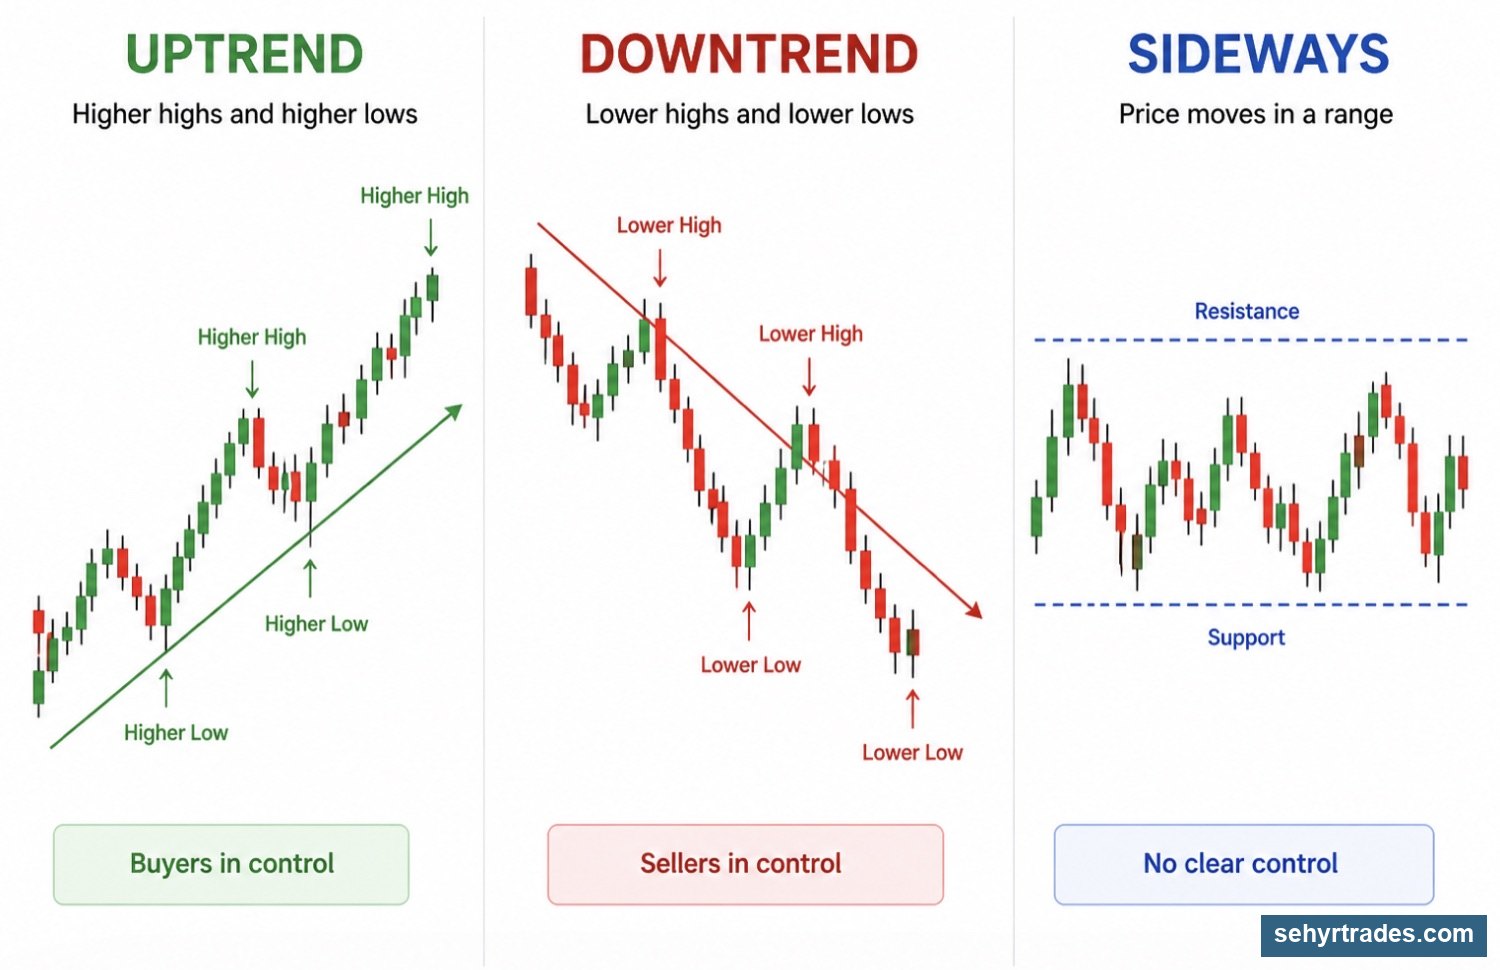
What is a trend?
A trend shows the direction price is moving over time. You are identifying, not predicting what it will do.
Types of trends
Uptrend:
- Higher highs
- Higher lows
- Buyers in control
Downtrend:
- Lower highs
- Lower lows
- Sellers in control
No trend (chop):
- Sideways movement
- No clear direction
- Weak control from both sides
Trend quality (this is what actually matters)
Not all trends are good to trade.
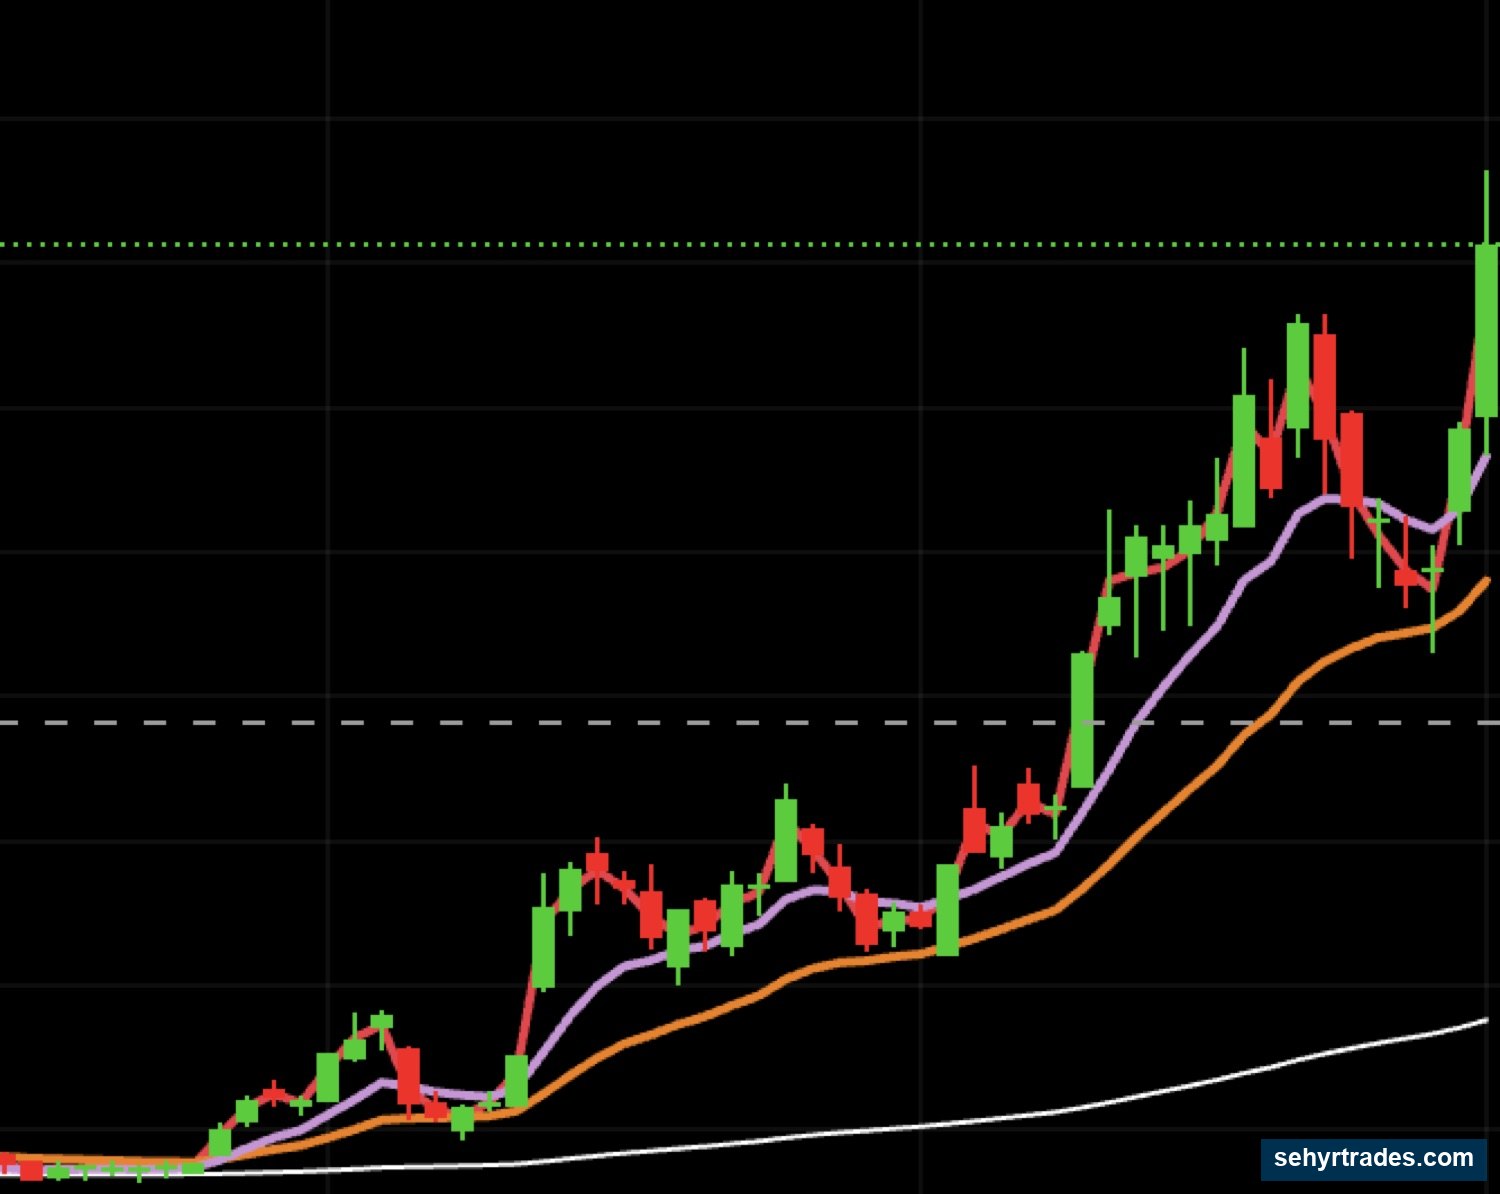
Clean trend:
- Smooth movement
- Clear higher highs / higher lows
- Clean pullbacks
- Closely following moving averages (will discuss in later chapter)
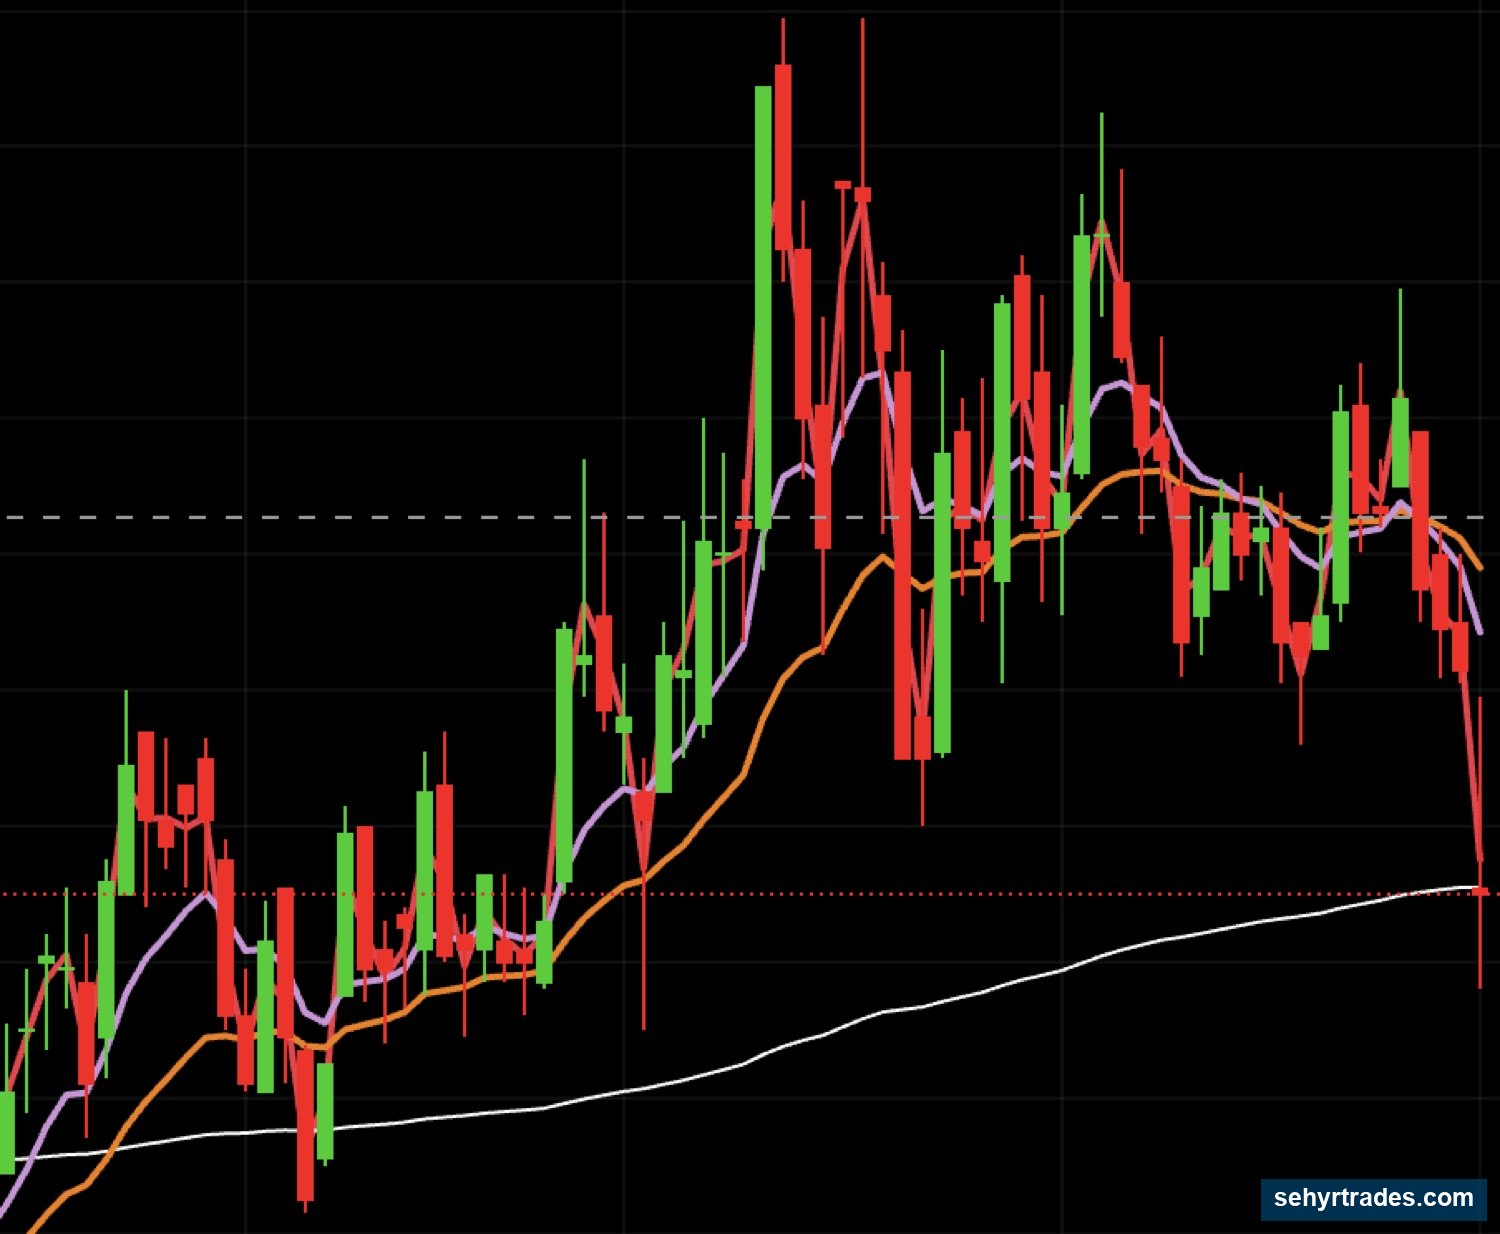
Weak trend:
- Sloppy movement
- Large wicks on either end
- Constant reversals
- No consistency
Here is an example of a clean trend on the daily chart (holding the orange line or the 23 EMA -- will explain moving averages in a later chapter).
Here is an example of a weak or choppy trend on the daily chart that is very hard to trade.
Trading the "Front Side" vs "Back Side" of a Move
This is where most traders make mistakes.
Front side:
- Early stage of a move
- Strong momentum
- Clean movement
- Continuation is more likely
👉 This is where good trades happen
Back side:
Later stage of a move
Momentum slows down
More wicks and hesitation
Higher chance of reversal
👉 This is where traders get trapped
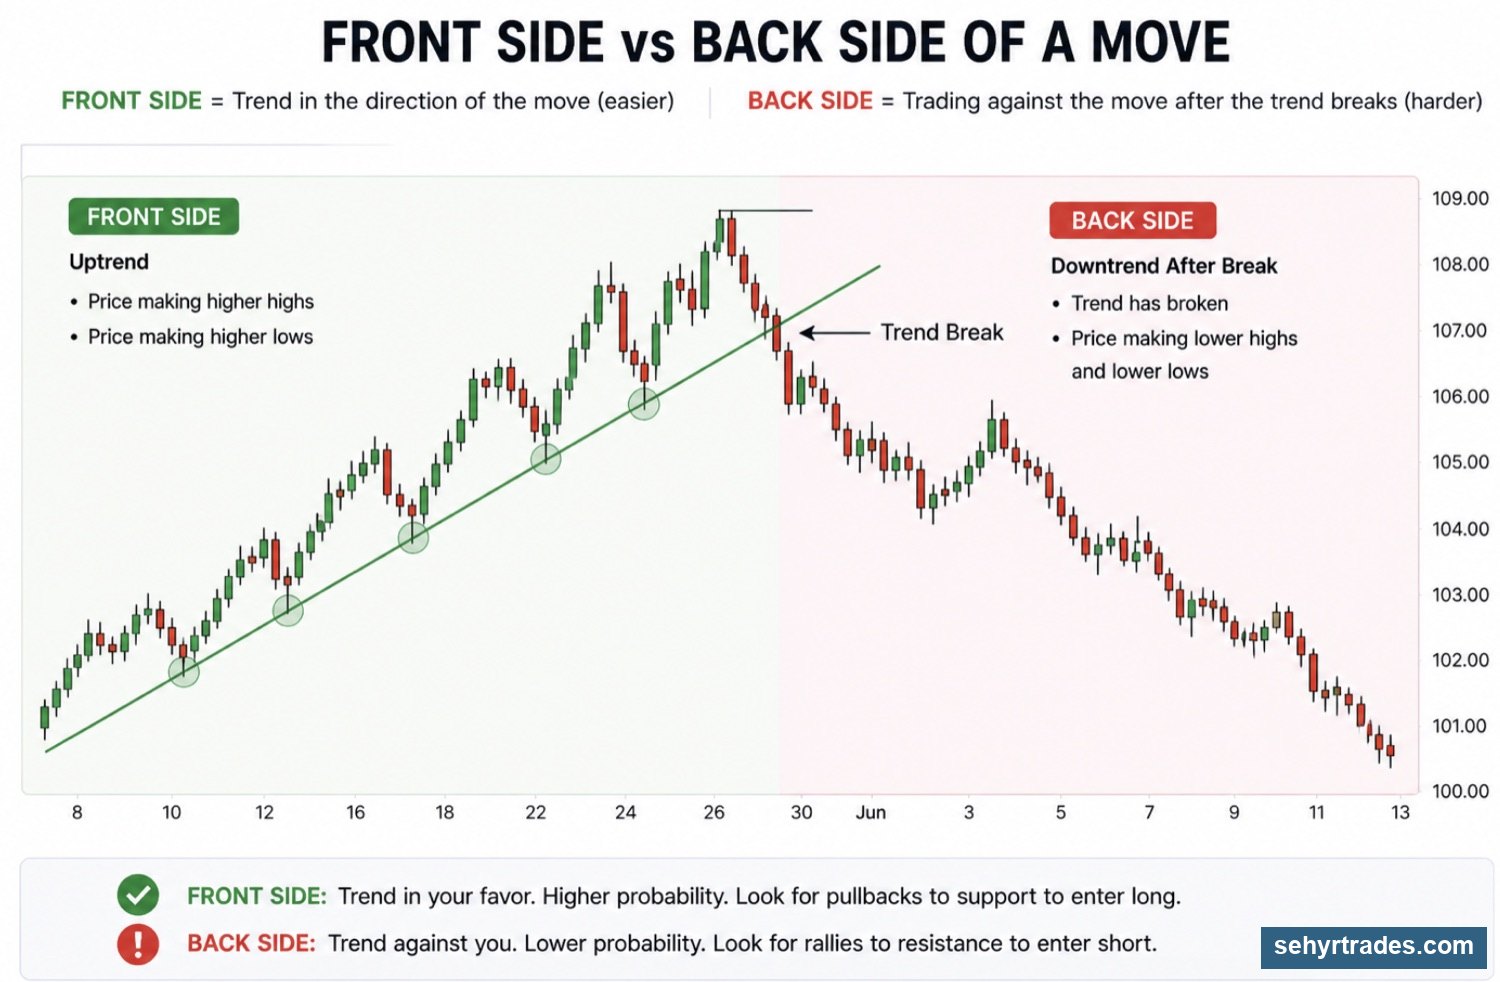
Signs a move is weakening (back side)
- Smaller candles
- More wicks
- Failed breakouts
- Price struggling to continue
Why this matters
Front side = better continuation setups
Back side = higher risk, lower probability
Helps you avoid chasing late moves
Trend vs chop (important)
If price is:
- not making clear highs/lows
- constantly reversing
👉 It is chop, and chop leads to bad trades
CHAPTER 5: KEY LEVELS (WHERE PRICE MATTERS)
What are key levels?
Key levels are areas where traders make decisions.
This is where:
- buyers step in
- sellers step in
- price either continues or reverses
👉 You are not trading everywhere
👉 You are trading at decision points
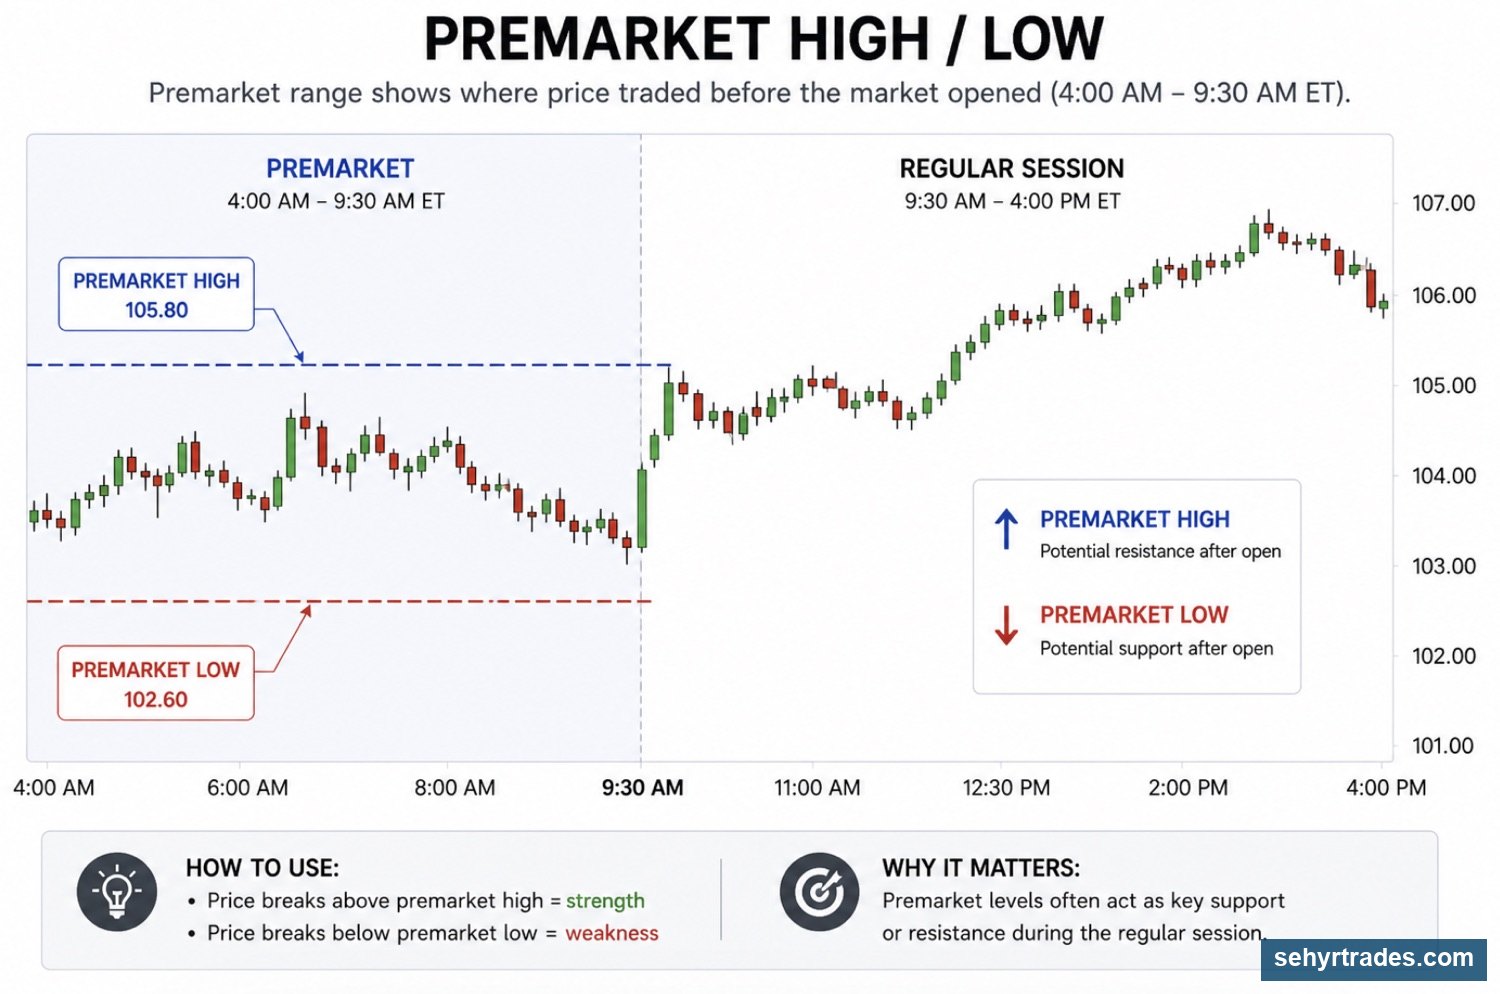
🔴 Premarket Levels(Important for Day Trading)
Premarket High
👉 Highest price before the open
- Break + hold → strength and continuation
- Rejection → potential reversal
Premarket Low
👉 Lowest price before the open
- Break → weakness and potential flush
- Hold → bounce setup
Previous Day Levels
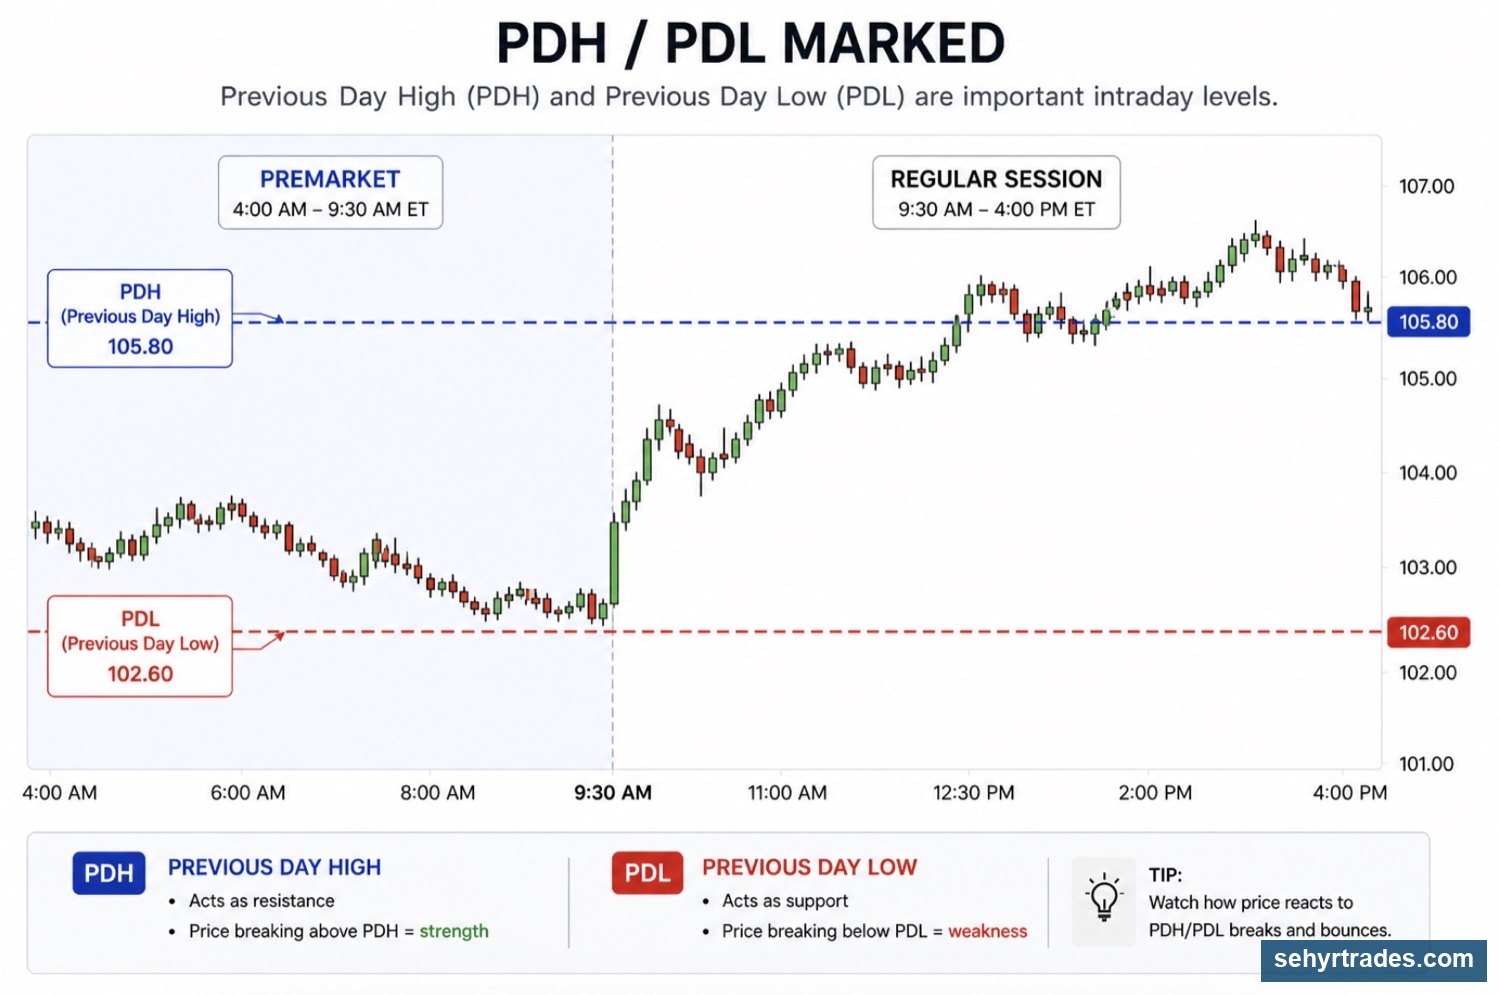
Previous Day High (PDH)
- Resistance level
- Widely watched
👉 At this level:
- Break → strength
- Rejection → potential pullback or reversal
Previous Day Low (PDL)
- Support level
- Widely watched
👉 At this level:
- Break → weakness / possible flush
- Hold → bounce
Intraday Levels
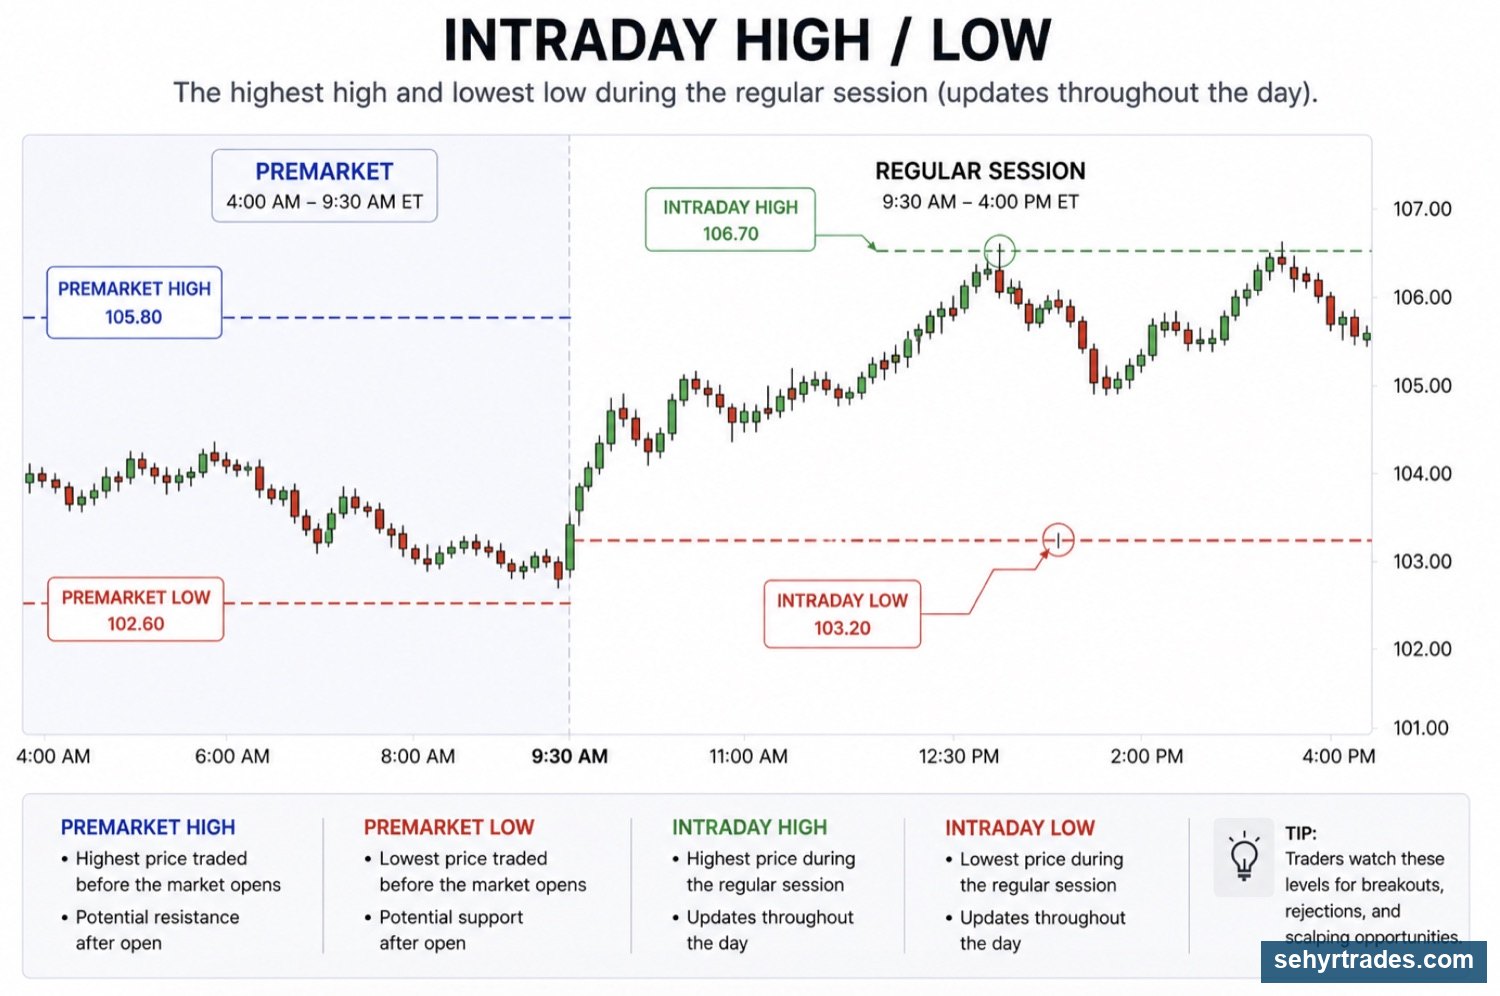
Intraday High
👉 Highest point during the trading day
At this level:
Break → continuation
Rejection → short-term reversal
Intraday Low
👉 Lowest point during the trading day
At this level:
Break → weakness
Hold → bounce
Candle Highs & Lows
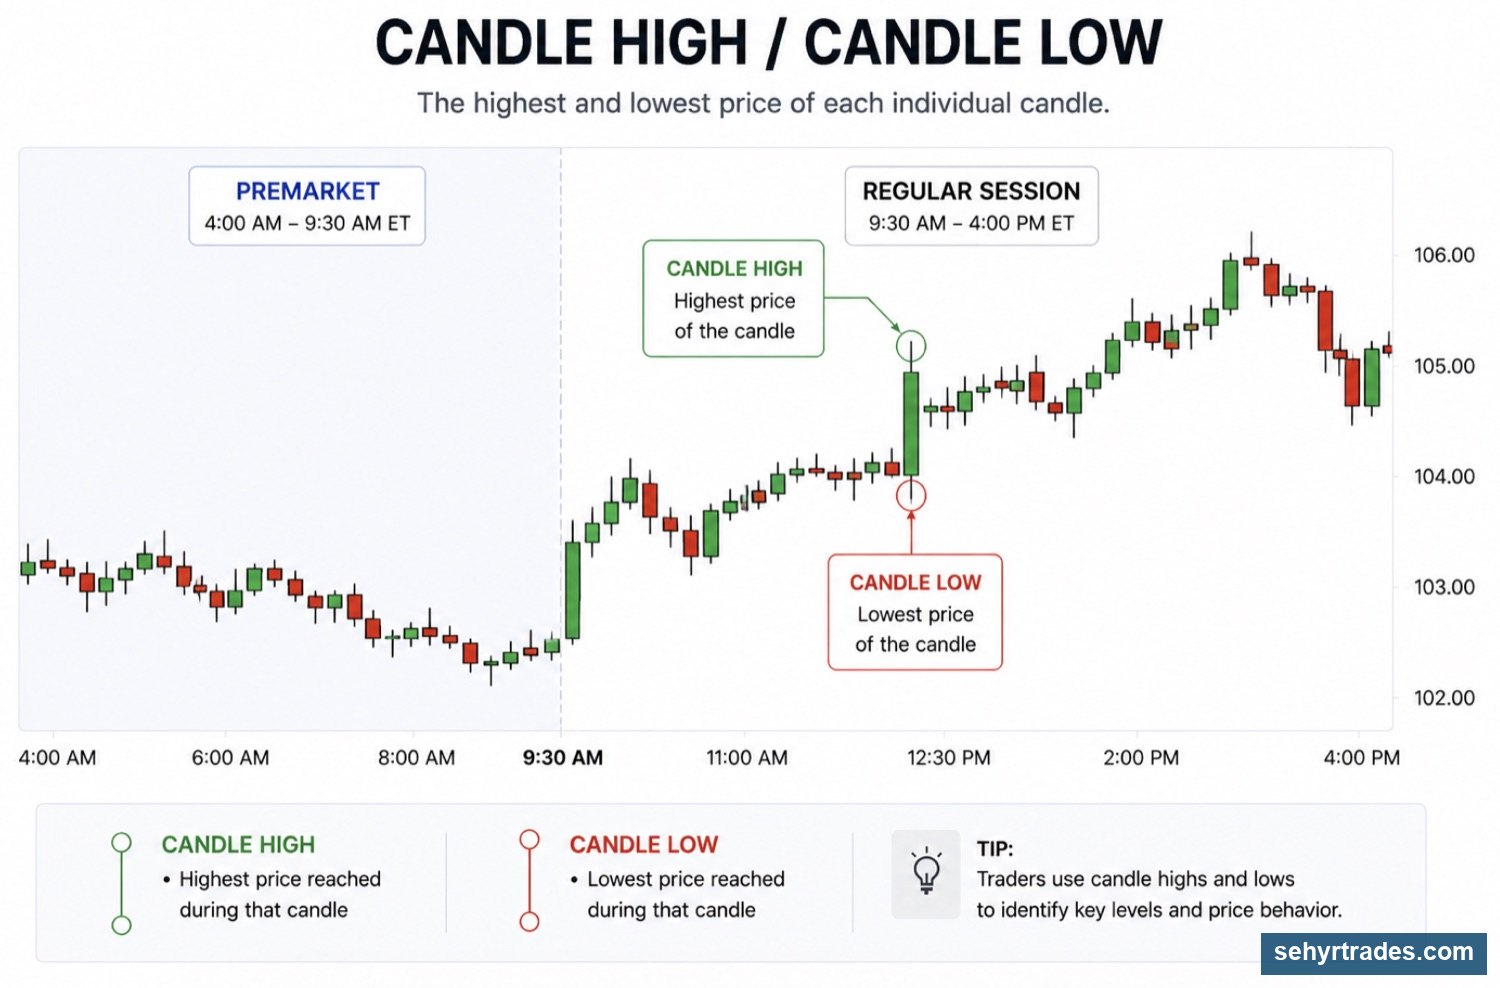
Previous candle highs often act as resistance
Previous candle lows often act as support
👉 Important for:
- entries
- tight risk
- momentum confirmation
A break above a candle high can show strength.
A break below a candle low can show weakness.
Multi-Timeframe Levels
One of the biggest mistakes new traders make is only looking at one timeframe.
Price does not exist on a single chart.
Every move is happening inside larger moves.
The Timeframes We Use
For day trading:
1 Minute → entries
5 Minute → short-term structure
30 Minute → important trend shifts
1 Hour → major intraday context
4 Hour → trend direction
Daily → overall trend
For swing trading:
4 Hour → setup development
Daily → primary trend
Weekly → major support, resistance, and market structure
Why This Matters
A stock may look strong on a 1-minute chart.
But if it is running directly into a major Daily resistance level, the move may fail.
Likewise, a stock may look weak on a 1-minute chart.
But if it is sitting at strong Weekly support, buyers may step in.
👉 The higher timeframe often tells us where the larger battle is taking place.
How We Use Higher Timeframes
We are often trying to trade the move occurring inside a larger timeframe candle.
For example:
A stock pulls back into 4-Hour support.
The 4-Hour candle begins holding.
The 1-minute chart starts showing strength.
👉 The higher timeframe identified the opportunity.
👉 The lower timeframe provided the entry.
Day Trading Example
Daily trend = up
4-Hour trend = up
Price pulls into support
1-minute chart shows buyers stepping in
👉 We are attempting to capture a move that aligns with the larger trend.
Swing Trading Example
Weekly trend = up
Daily chart pulls back into support
4-Hour chart begins reversing
👉 The swing trade is based on what the higher timeframes are doing.
The lower timeframe simply helps improve the entry.
The Goal
The goal is not to trade every move.
The goal is to trade the moves that align with higher timeframe context.
Higher timeframes provide direction.
Lower timeframes provide execution.
🔄 Support Becomes Resistance
One of the most important concepts in trading is that levels can change roles.
When a support level breaks, the buyers who were defending that area have lost control. If price later returns to that same level, sellers will often step in, causing the old support level to act as resistance.
The opposite is also true. When resistance breaks and buyers successfully push price higher, that same level will often act as support if price pulls back.
Understanding this concept helps traders identify areas where price may react in the future.
📈 Beyond Basic Levels
So far, we have focused on levels that come from obvious areas on the chart, such as:
Premarket highs and lows
Previous day highs and lows
Candle highs and lows
Support and resistance zones
As traders gain experience, they often begin using additional tools to identify areas where price may react.
Some examples include:
TRP levels
Trendlines
EMAs
Standard deviation bands
While these tools are all different, they serve a similar purpose: helping traders identify areas that may become important.
One concept you will hear frequently in trading is confluence.
Confluence occurs when multiple levels align in the same area.
For example:
Daily support + TRP level
Trendline + support zone
EMA + support level
Standard deviation band + resistance
When several factors point to the same area, traders often pay closer attention because reactions can become more meaningful.
This does not guarantee a trade will work.
However, it can help identify areas where buyers and sellers may become more active.
We will cover these tools in greater detail in a later lesson.
.
🔄 What Happens at a Level?
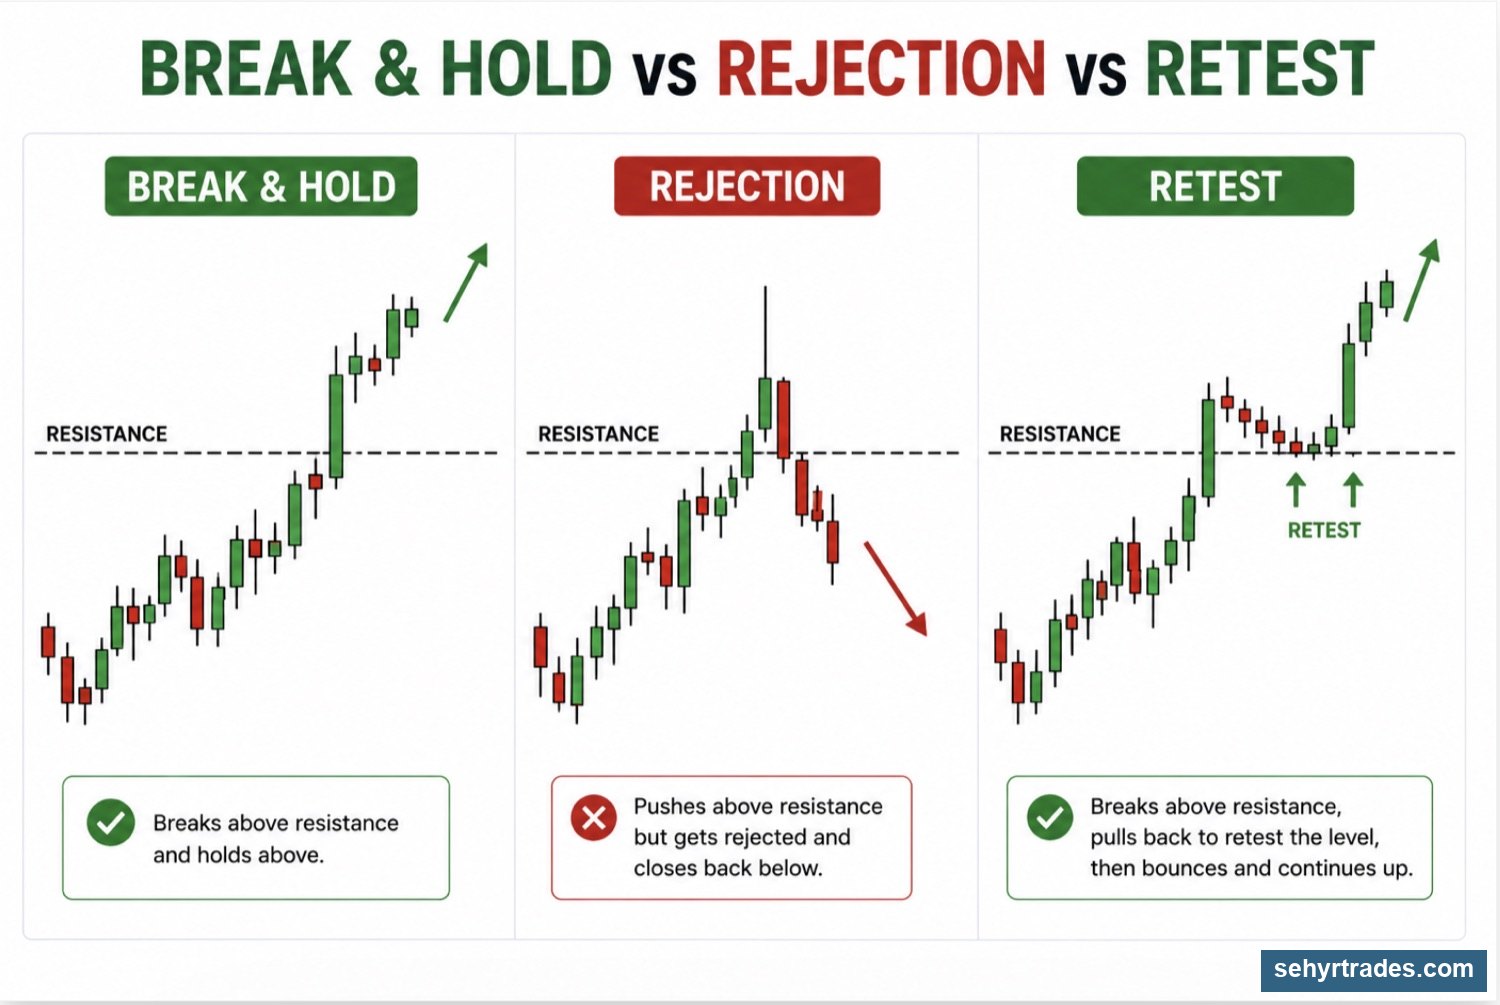
Once price reaches an important level, traders are watching for a reaction. While every chart is different, most reactions fall into one of two categories.
Rejection
A rejection occurs when price reaches a level and is pushed away from it.
For example, a stock may rally into resistance and immediately sell off, or it may drop into support and quickly bounce.
Rejections tell us that buyers or sellers are actively defending that area.
Many reversal and bounce trades begin with a rejection from an important level.
Break and Hold
A break and hold occurs when price successfully moves through a level and remains above or below it.
Instead of rejecting, price accepts the new area and continues moving in that direction.
This is often how momentum and continuation trades develop.
For example, if a stock breaks above resistance and continues holding above that level, traders may view it as a sign of strength rather than a temporary move.
.
⚠️ What to Avoid
One of the biggest mistakes new traders make is forcing trades where there is no clear level.
Try to avoid:
Trading in the middle of a range
Drawing random lines that price has never respected
Taking trades without understanding nearby support or resistance
Ignoring higher timeframe context
The best trades often occur when price reaches an area that other traders are watching.
🎯 Key Idea
Levels do not predict what price will do next.
Instead, they tell us where decisions are likely to be made.
Your job as a trader is not to predict the future.
Your job is to identify important areas, wait for price to reach them, and then observe how buyers and sellers respond.
CHAPTER 6: CHART PATTERNS & FORMATIONS
There are hundreds of chart and candlestick patterns used by traders.
This lesson covers some of the most common patterns you may encounter.
The goal is not to memorize every pattern.
The goal is to recognize recurring behavior that appears on charts.
Patterns can provide useful information, but they should never be traded in isolation.
The trend, level, volume, and overall context matter more than the pattern itself.
CONTINUATION PATTERNS
Continuation patterns occur when a trend pauses before continuing in the same direction.
These patterns often represent a temporary balance between buyers and sellers before one side regains control.
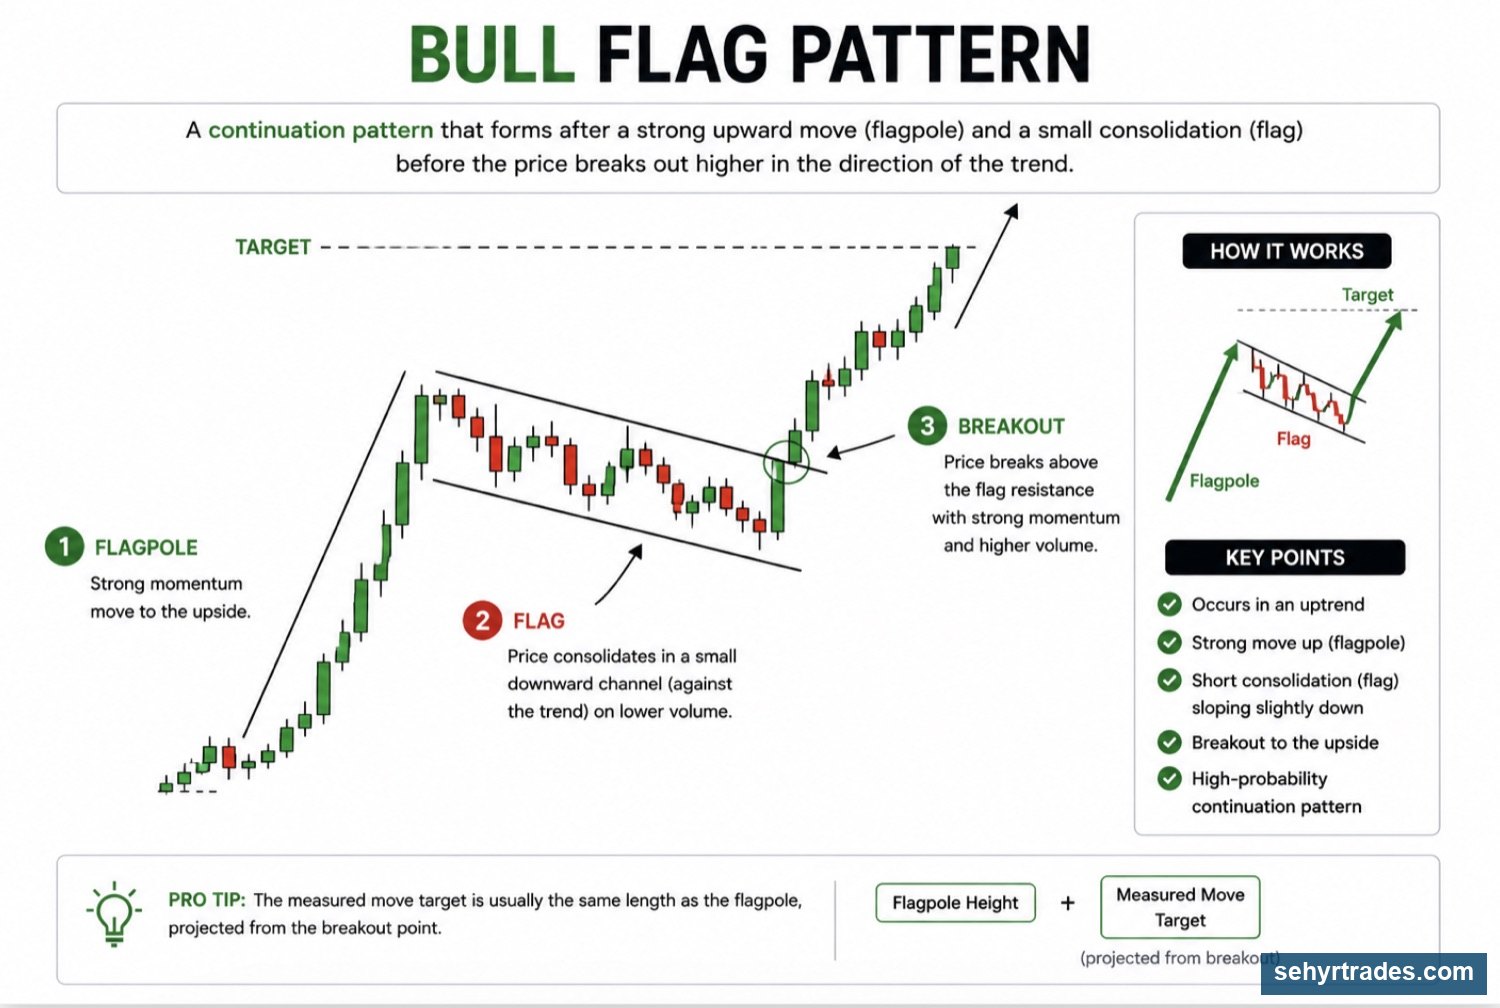
Bull Flag
A bull flag occurs after a strong move higher.
Price then consolidates or pulls back slightly before attempting to continue higher.
Characteristics:
* Strong move upward
* Brief consolidation
* Trend remains intact
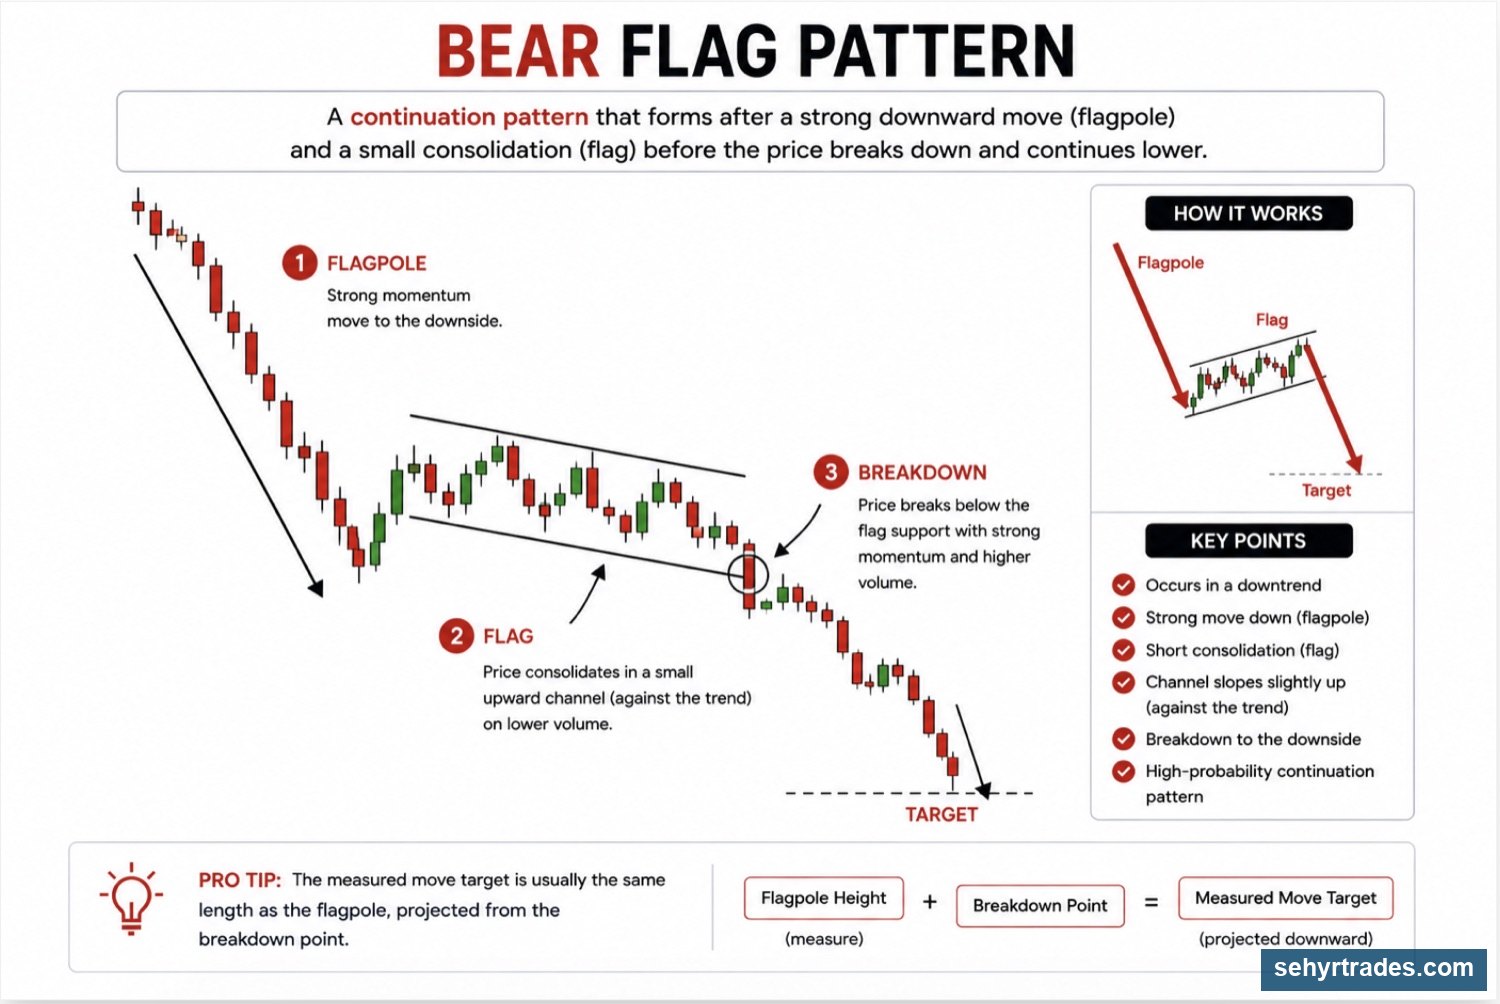
Bear Flag
A bear flag is the opposite of a bull flag.
Price moves lower, pauses, and then attempts to continue lower.
Characteristics:
Strong move downward
Brief consolidation
Trend remains intact
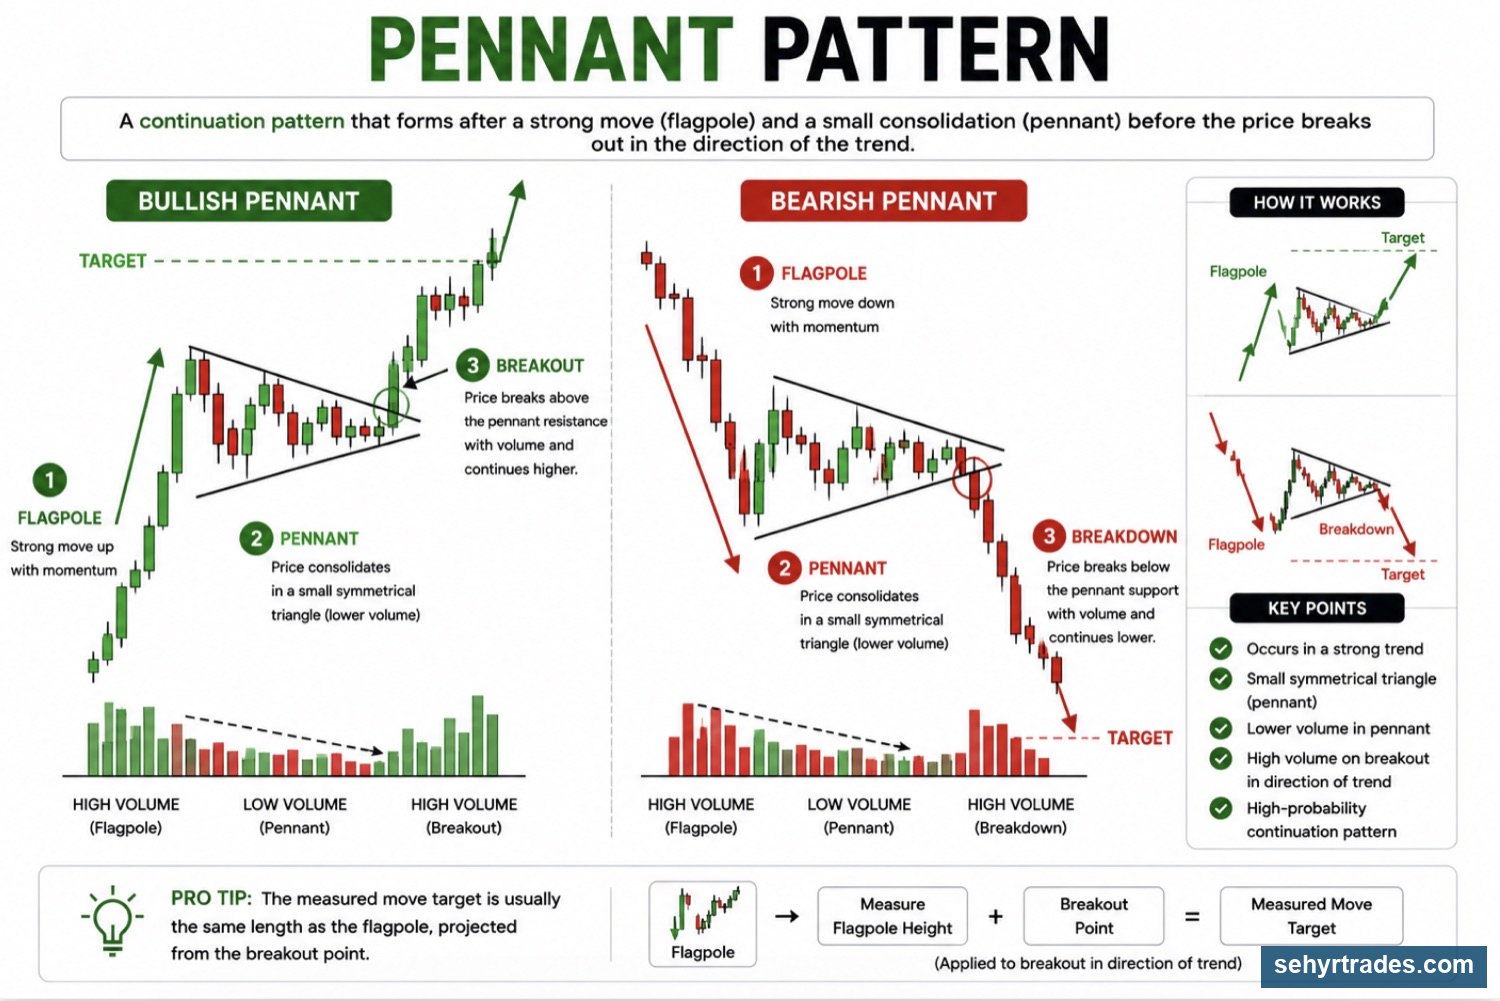
PENNANTS
Pennants form when price begins tightening after a strong move.
The range becomes smaller and smaller before eventually breaking in one direction.
Characteristics:
- Strong move before formation
- Tightening price action
- Often followed by expansion
CHANNEL PATTERNS
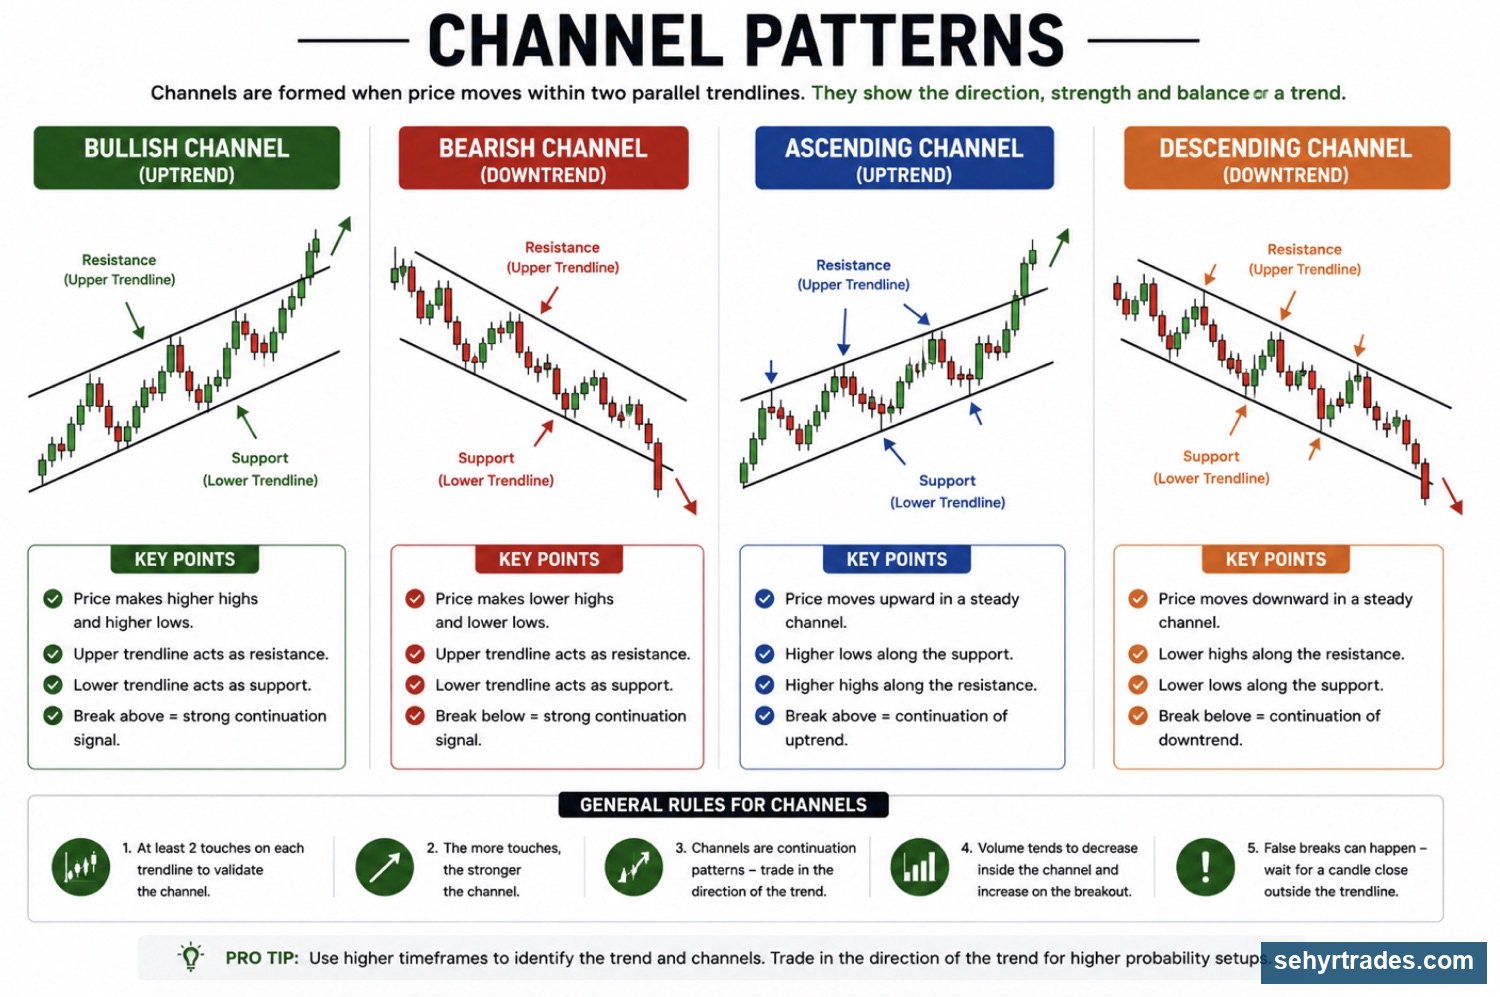
Channels occur when price moves between support and resistance while maintaining a trend.
Channels can be:
- Ascending
- Descending
- Sideways
Channels help traders visualize the direction and structure of a move.
🔄 Compression Patterns
Compression occurs when price begins trading in a smaller and smaller range.
As buyers and sellers battle for control, the market stores energy that is often released through a larger move.
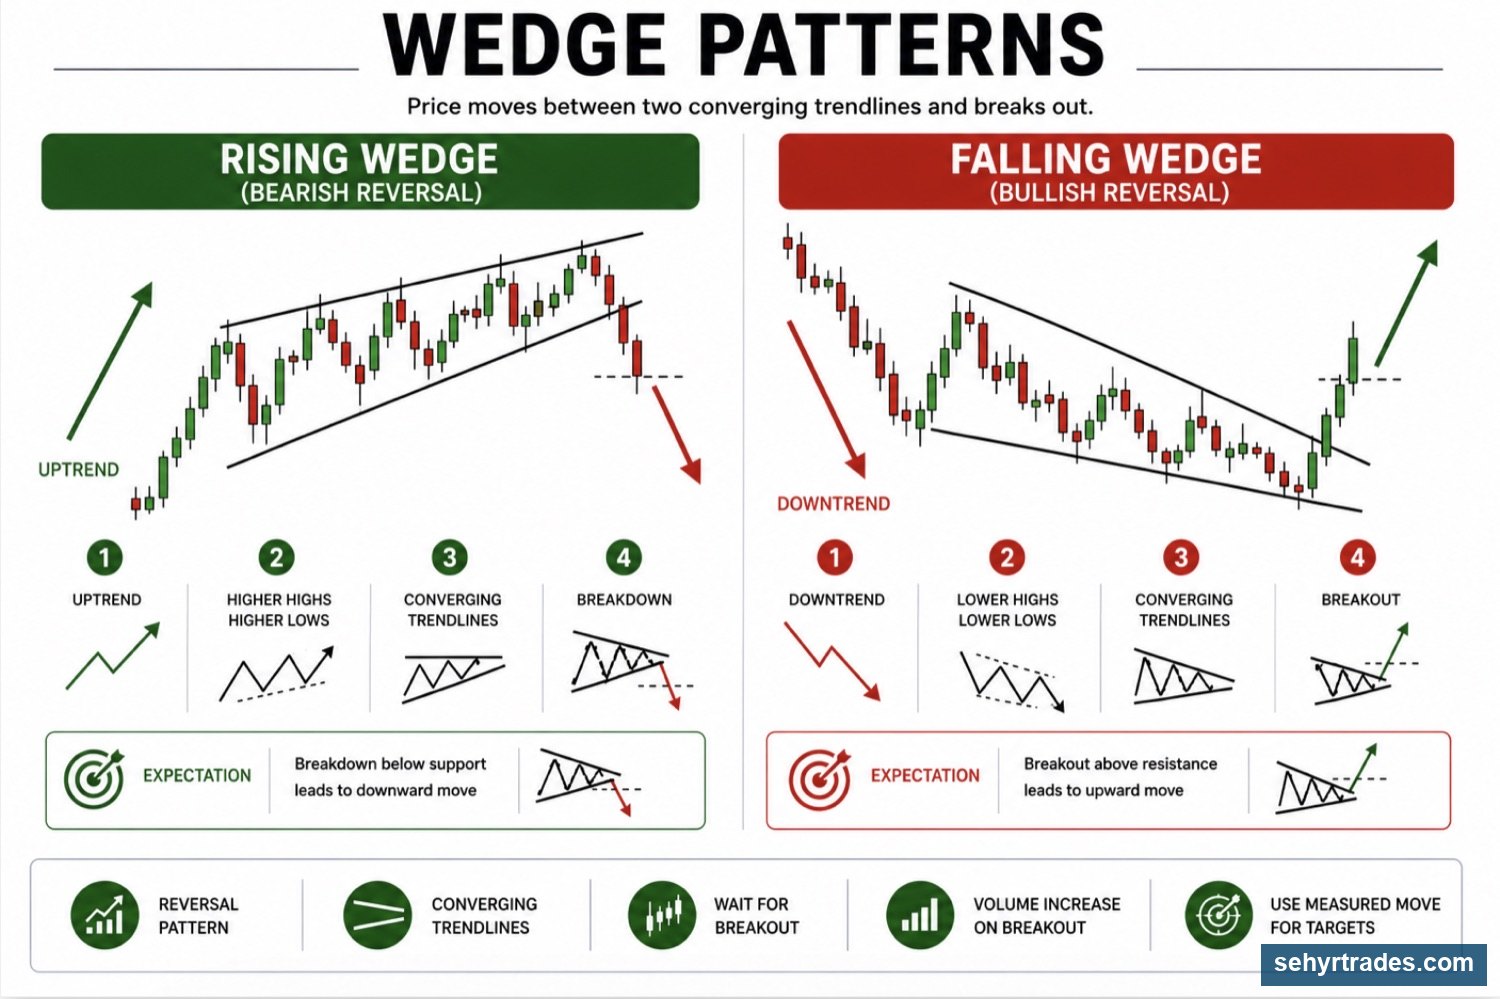
Wedges
Wedges form when price gradually tightens while still moving in one direction.
Momentum often slows as the pattern develops.
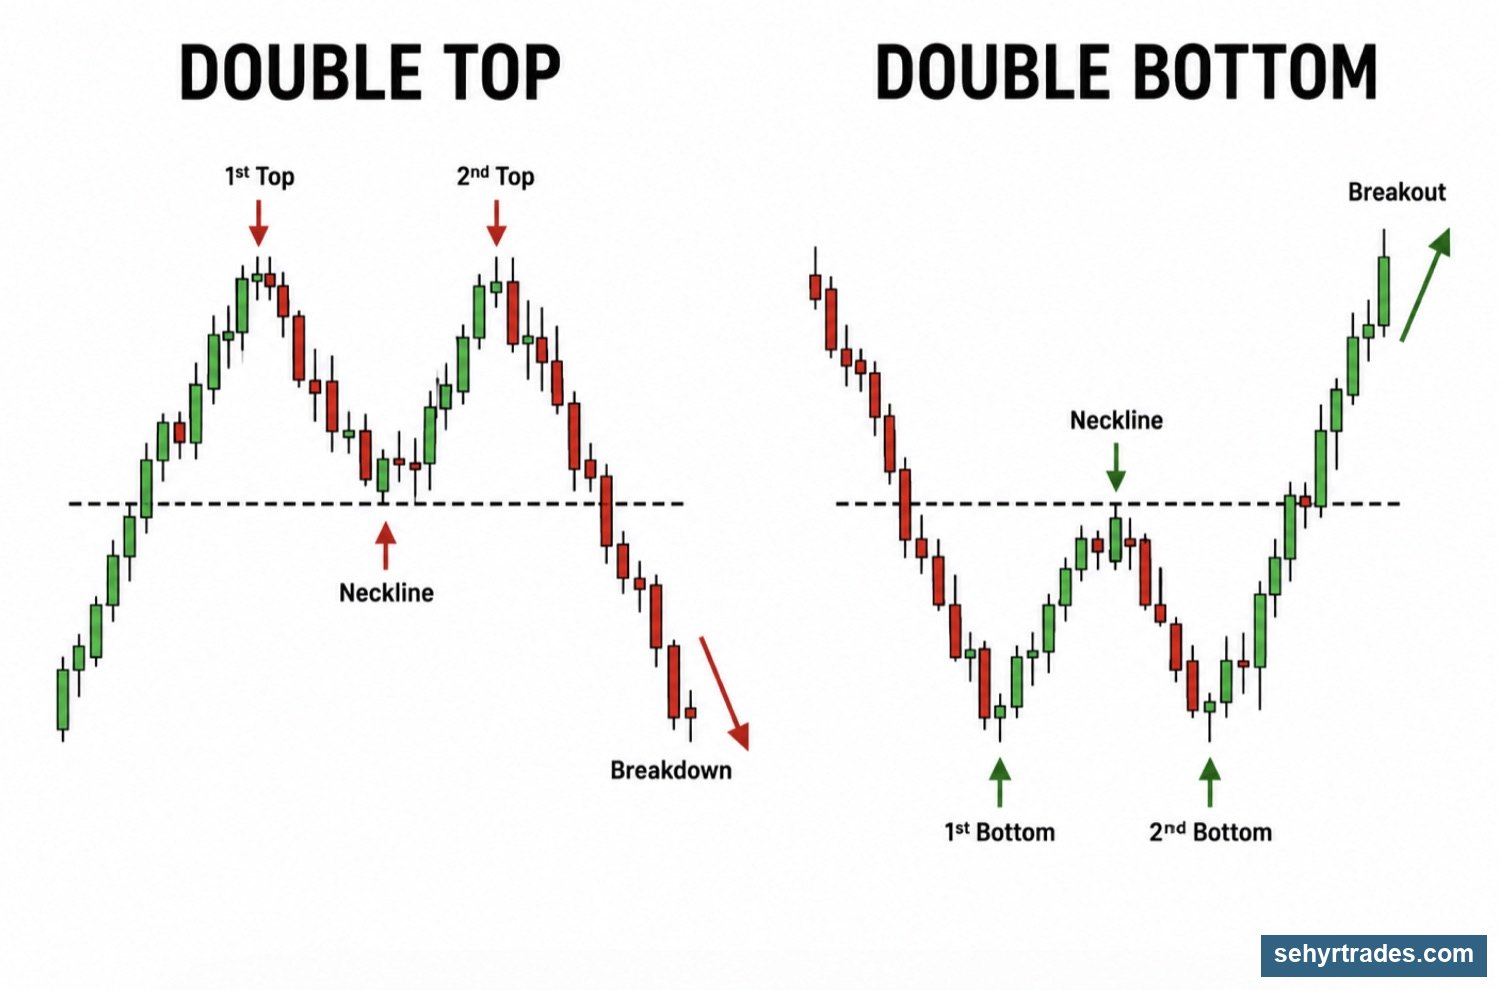
Double Top
A double top forms when price reaches a resistance area twice but fails to break through.
This can signal weakening buying pressure.
Double Bottom
A double bottom forms when price reaches a support area twice and successfully holds.
This can signal strengthening buying pressure.
Common Candlestick Patterns
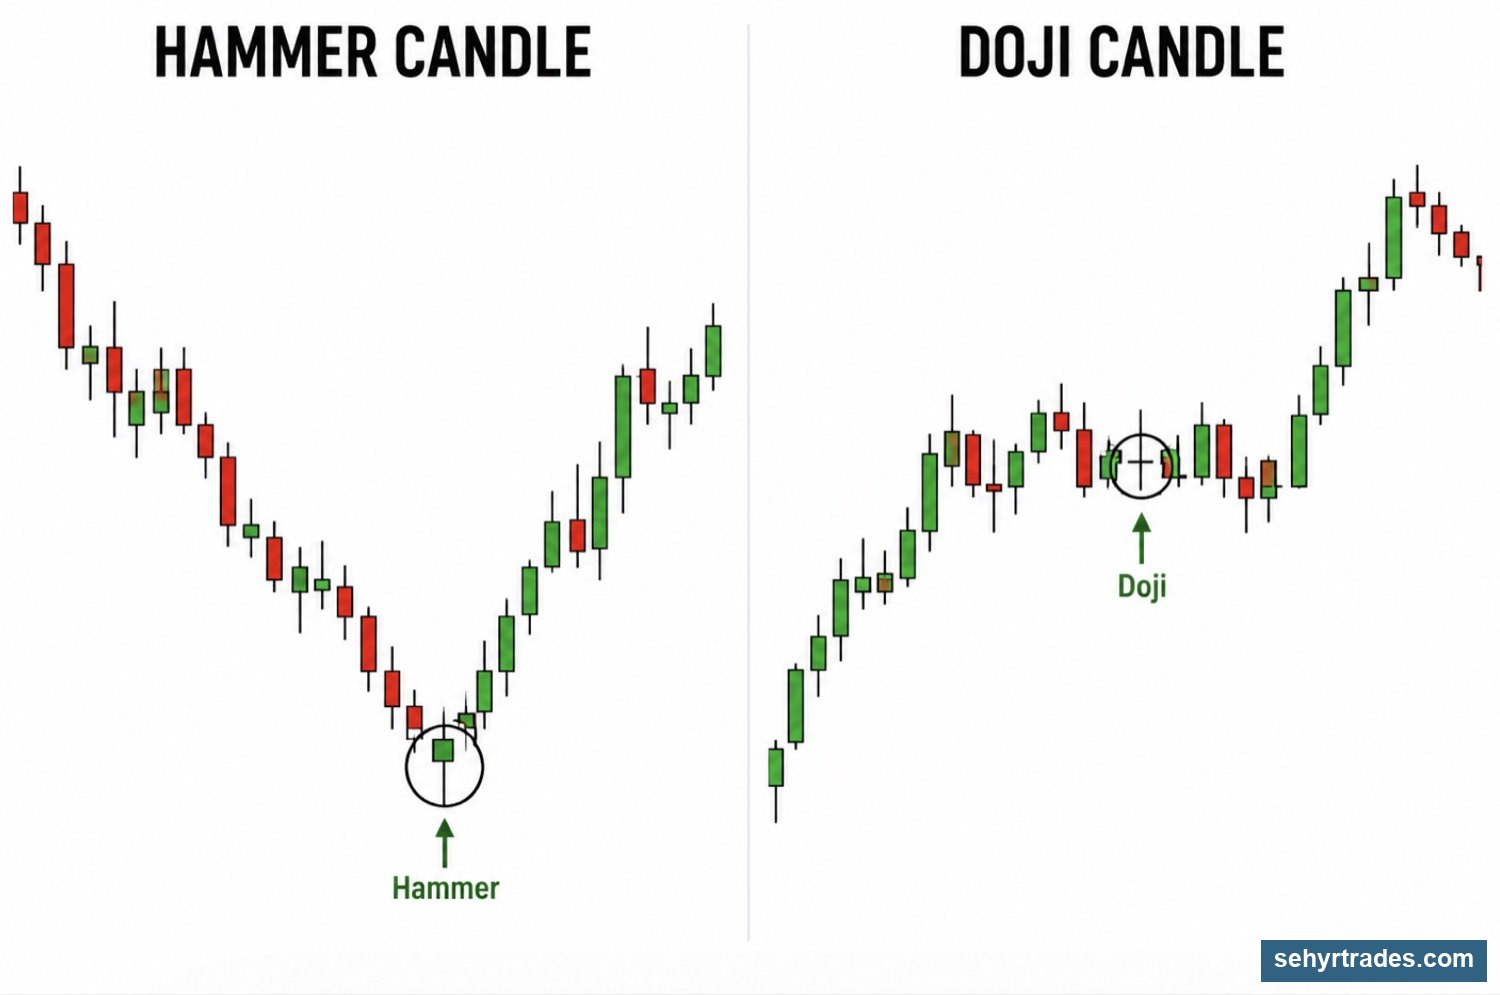
Candlestick patterns are smaller patterns that form within individual candles or groups of candles. Like chart patterns, there are MANY patterns and formations but these 2 are important candlesticks you should recognize.
Hammer
A hammer shows strong rejection from below.
Sellers pushed price lower, but buyers stepped in and pushed price back up.
Hammers are often seen near support levels.
Doji
A doji represents indecision.
Neither buyers nor sellers gained clear control during the candle.
Dojis often appear during consolidations, pauses, or before larger moves.
CHAPTER 7: TRADE QUALITY (VOLUME, FLOAT & SPREAD)
By this point, you understand charts, trends, levels, and patterns.
However, there is one more question that should be asked before entering any trade:
👉 Is this stock actually worth trading?
Many traders focus only on the setup.
They see a breakout, a support level, or a pattern and immediately want to enter.
What they often ignore is the quality of the stock itself.
Two stocks can have identical charts and behave completely differently.
Trade quality helps us evaluate how a stock is likely to move and how easy it will be to trade.
VOLUME
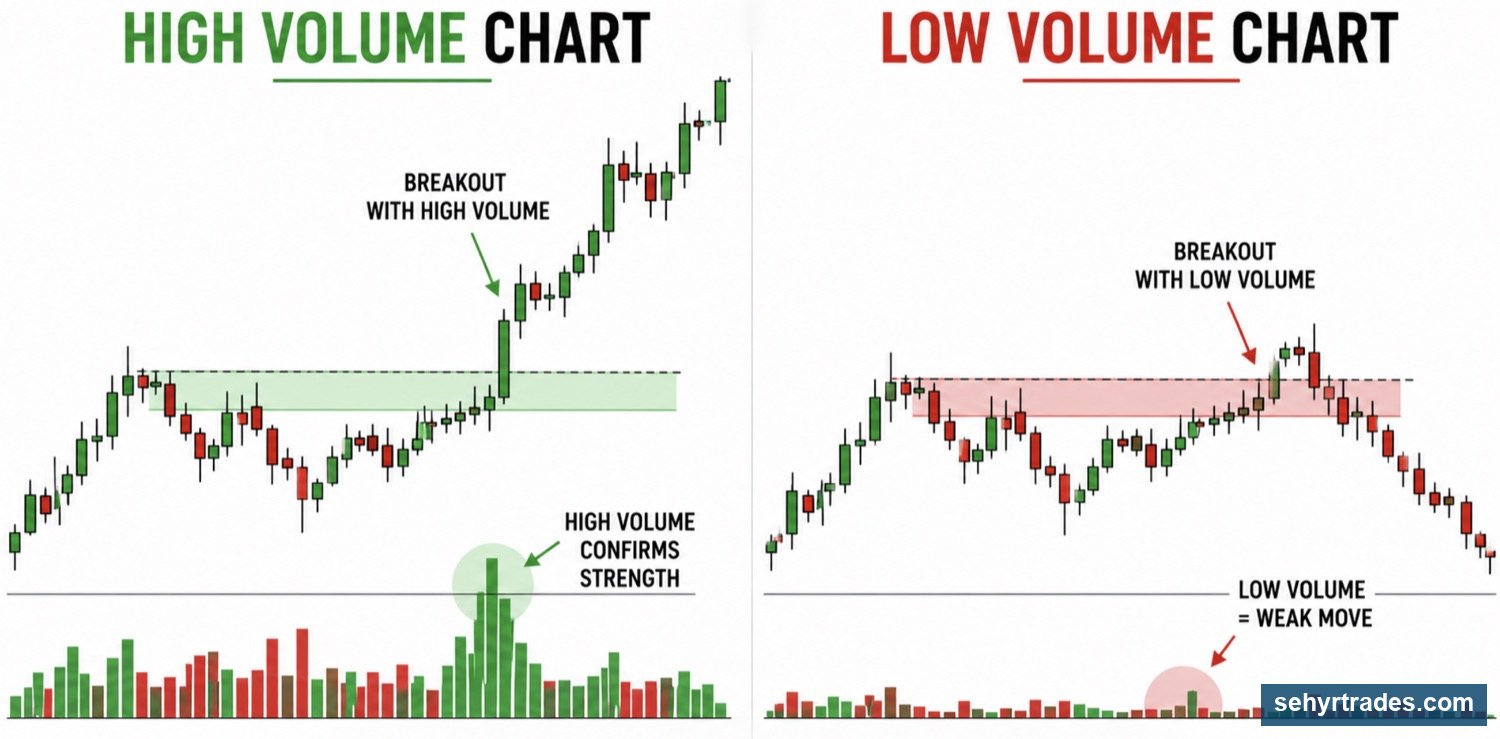
Volume represents the number of shares traded during a specific period of time.
In simple terms, volume tells us how much participation exists in a stock.
When volume is high, more buyers and sellers are involved.
When volume is low, fewer traders are participating.
Think of volume as attention.
A stock with strong volume is attracting attention.
A stock with weak volume is often being ignored.
Why Volume Matters
Volume helps validate price movement.
If a stock is moving higher with strong volume, there is usually real participation behind the move.
If a stock is moving higher on very little volume, the move may be less reliable.
Higher volume can also provide:
Easier entries
Easier exits
Better liquidity
More consistent movement
Low volume stocks often experience:
Choppy movement
Sudden reversals
Difficult executions
For this reason, many traders prefer stocks that already have strong volume.
📈 Float (also discussed in Charting Basics)
Float refers to the number of shares available for public trading.
While volume tells us how much participation exists, float helps explain how quickly a stock can move.
Low Float Stocks
Low float stocks have fewer shares available for trading.
Because supply is limited, strong buying pressure can push these stocks higher very quickly.
Characteristics of low float stocks:
Fast movement
Large percentage gains
Higher volatility
Greater risk
These are often the stocks that appear on top gainer lists and make dramatic moves.
High Float Stocks
High float stocks have many shares available for trading.
Because more shares exist, it generally takes more buying pressure to move the stock.
Characteristics of high float stocks:
Slower movement
More stable price action
Lower volatility
Often easier to manage
Many large-cap stocks fall into this category.
- Low Float (Under ~20 million shares)
Fewer shares available
Price moves easily
More volatile
- Medium Float (20M – 100M shares)
More shares available
More controlled movement
- High Float (100M+ shares)
Many shares available
Harder to move price
More stable
Neither is Better
A common misconception is that low float stocks are always superior because they move faster.
In reality, every advantage comes with a tradeoff.
Low float stocks can move higher quickly.
They can also move lower just as quickly.
High float stocks may move more slowly, but they often provide cleaner and more predictable behavior.
The goal is not to find the "best" float.
The goal is to understand what type of movement you should expect.
💰 Spread
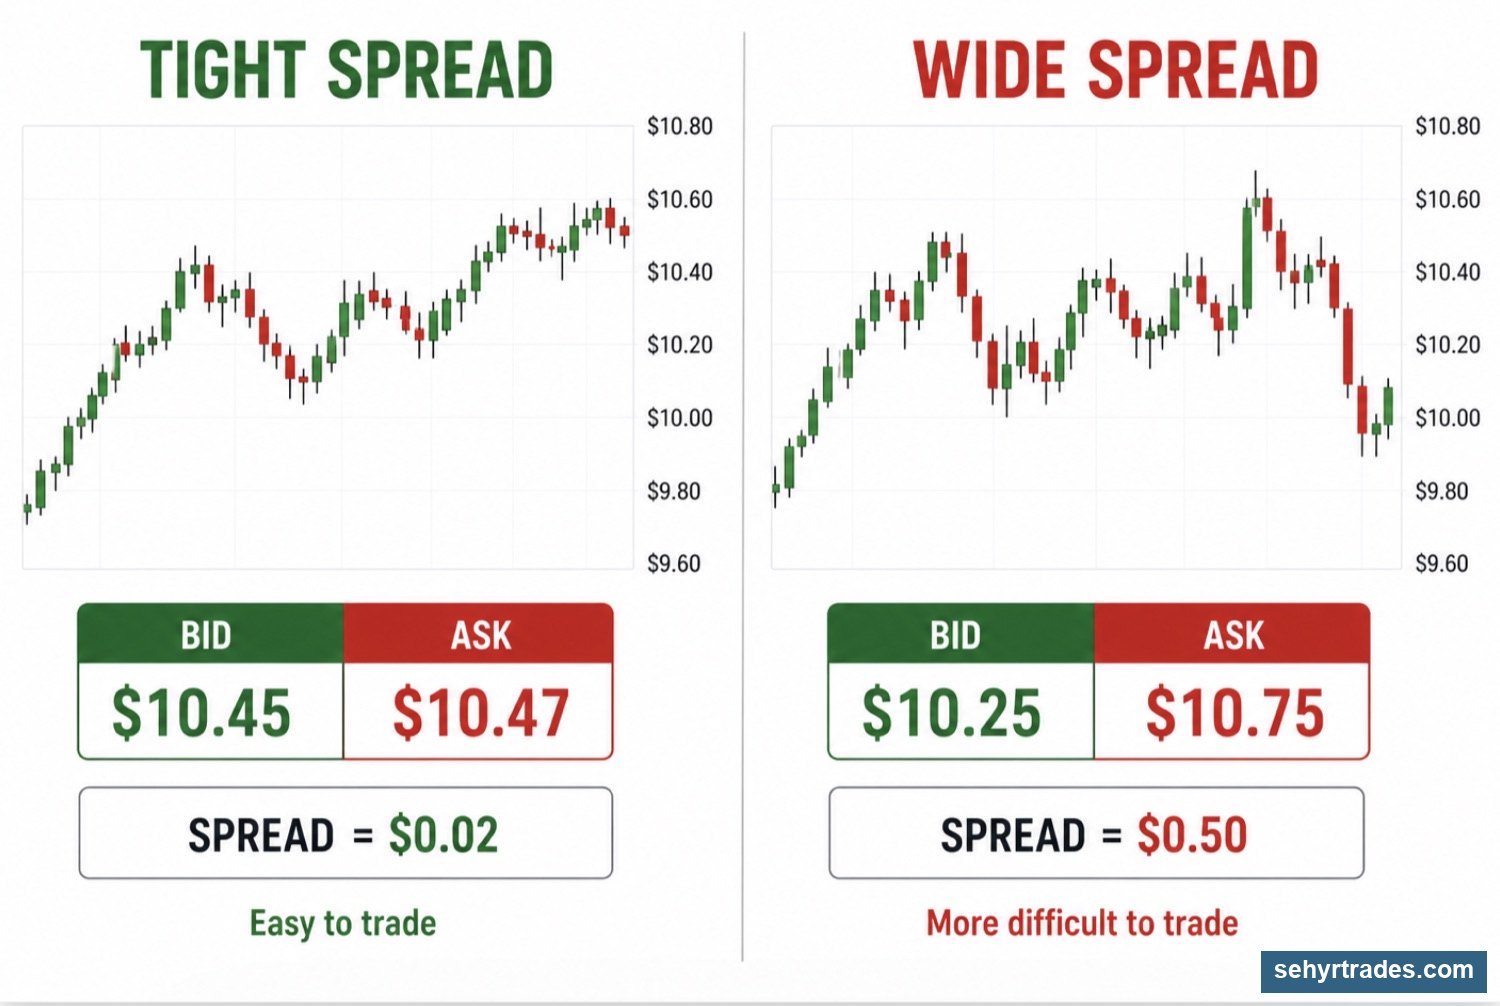
Spread is the difference between the bid price and the ask price.
The bid is the highest price a buyer is willing to pay.
The ask is the lowest price a seller is willing to accept.
The difference between those two numbers is called the spread.
Why Spread Matters
Spread directly impacts execution.
A stock with a tight spread allows traders to enter and exit more efficiently.
A stock with a wide spread can immediately put a trader at a disadvantage.
For example:
A stock trading at:
Bid: $5.00
Ask: $5.10
already creates a $0.10 difference before the trade even begins.
For traders using tighter stops, that difference can become significant.
Tight Spread
Characteristics:
Easier entries
Easier exits
Lower execution risk
Wide Spread
Characteristics:
Harder entries
Harder exits
Increased execution risk
🧠 Putting It All Together
Imagine two stocks with identical charts.
Stock A:
Strong volume
Reasonable float
Tight spread
Stock B:
Low volume
Extremely low float
Wide spread
Even though the chart may look the same, the actual trading experience could be completely different.
This is why experienced traders evaluate more than just the setup.
They evaluate the quality of the stock itself.
⚠️ Important Note
Patterns are descriptions of behavior.
They do not predict the future.
A pattern by itself is not a trading signal.
Always consider:
Trend
Key levels
Volume
Market context
Spread
before making a trading decision.
🎯 Key Idea
A good chart does not automatically create a good trade.
Before entering any position, ask yourself:
Does this stock have enough volume?
What type of float does it have?
Is the spread reasonable?
The answers to those questions can dramatically affect the outcome of a trade.
CHAPTER 8: TRADING TOOLS (IMPORTANT SECTION!)
(Also read #tradingview-template-and-indicators)
By now, you understand:
How charts work
How trends form
Where important levels exist
Common chart patterns
How to evaluate trade quality
The next step is understanding trading tools.
Trading tools can help us identify trends, levels, and potential opportunities.
However, one of the biggest mistakes new traders make is relying too heavily on indicators.
Many traders spend years searching for the perfect indicator.
The reality is that no indicator can predict the future.
Price always comes first.
Tools should support your analysis, not replace it.
📊 EMAs (Exponential Moving Averages)
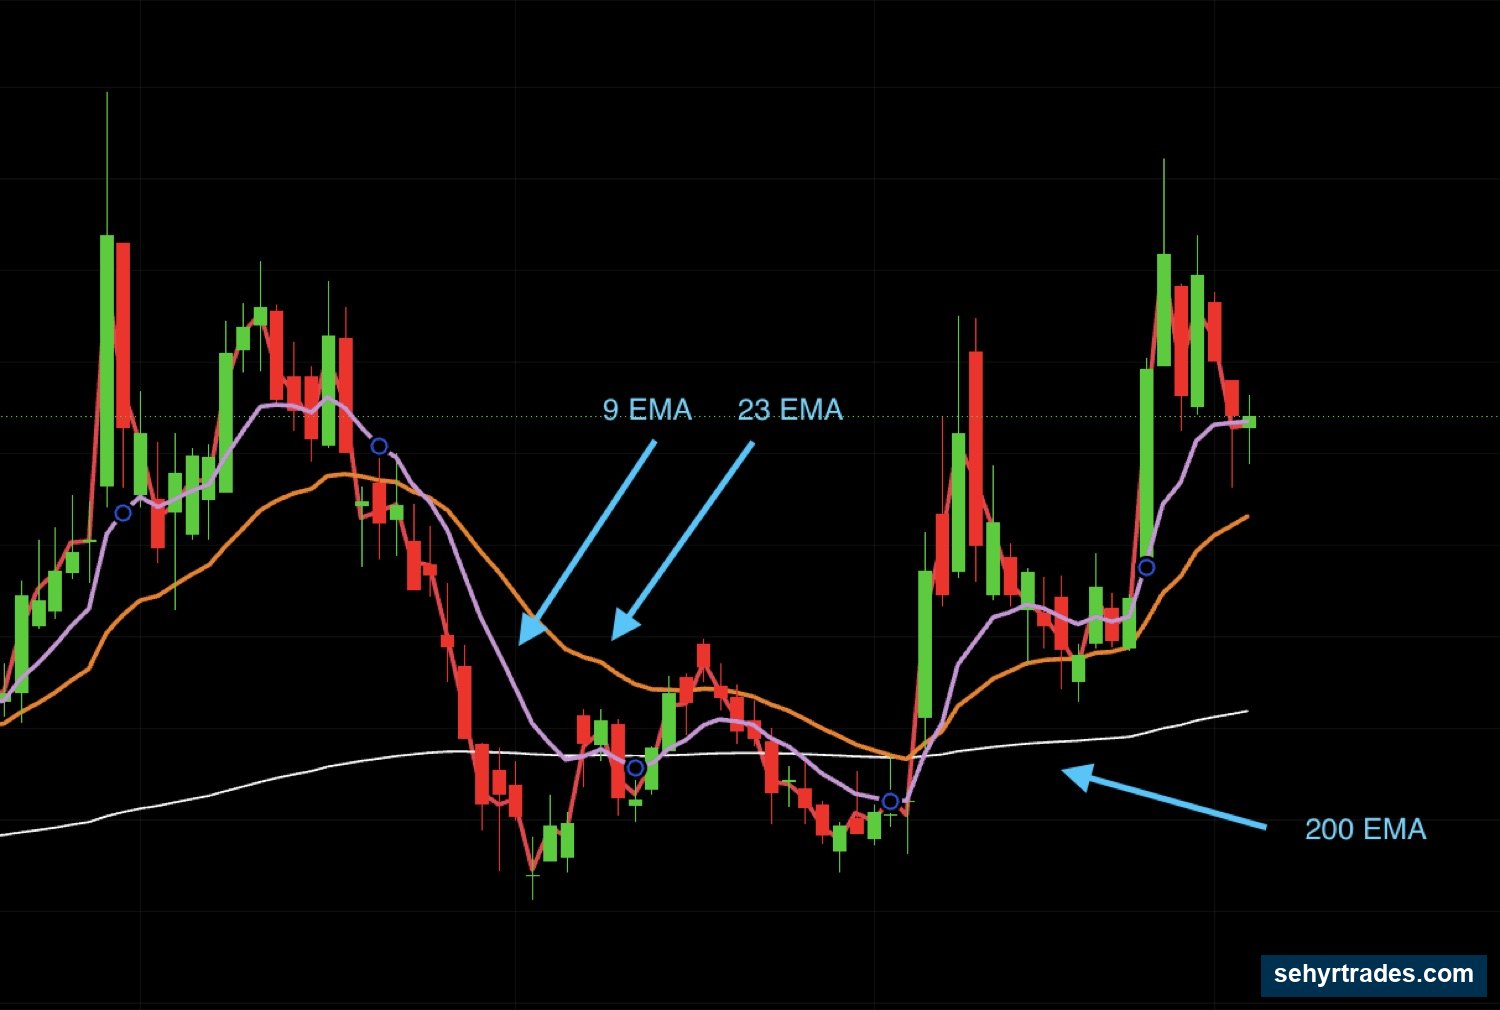
An EMA, or Exponential Moving Average, is a line plotted on a chart that tracks the average price of a stock over a specific period of time.
Unlike price candles, which can move dramatically from one candle to the next, EMAs smooth out price movement and make trends easier to see.
The EMAs I use most often are:
9 EMA
23 EMA
200 EMA
The 9 EMA
The 9 EMA reacts quickly to price movement and helps identify short-term direction.
When price remains above the 9 EMA, buyers are generally maintaining control.
When price remains below it, sellers are generally maintaining control.
The 9 EMA is often used to gauge short-term momentum.
The 23 EMA
The 23 EMA is one of my primary trend tools.
Many healthy trends pull back into the 23 EMA before continuing higher.
For this reason, I often use it as a guide for structure rather than as a precise entry signal.
When price remains above the 23 EMA, the trend is often still intact.
When price begins losing the 23 EMA repeatedly, it can be a sign that the trend is weakening.
The 200 EMA
The 200 EMA is widely followed by traders and institutions.
Because so many market participants watch it, price often reacts around this area.
The 200 EMA can help identify:
Long-term trend direction
Major support
Major resistance
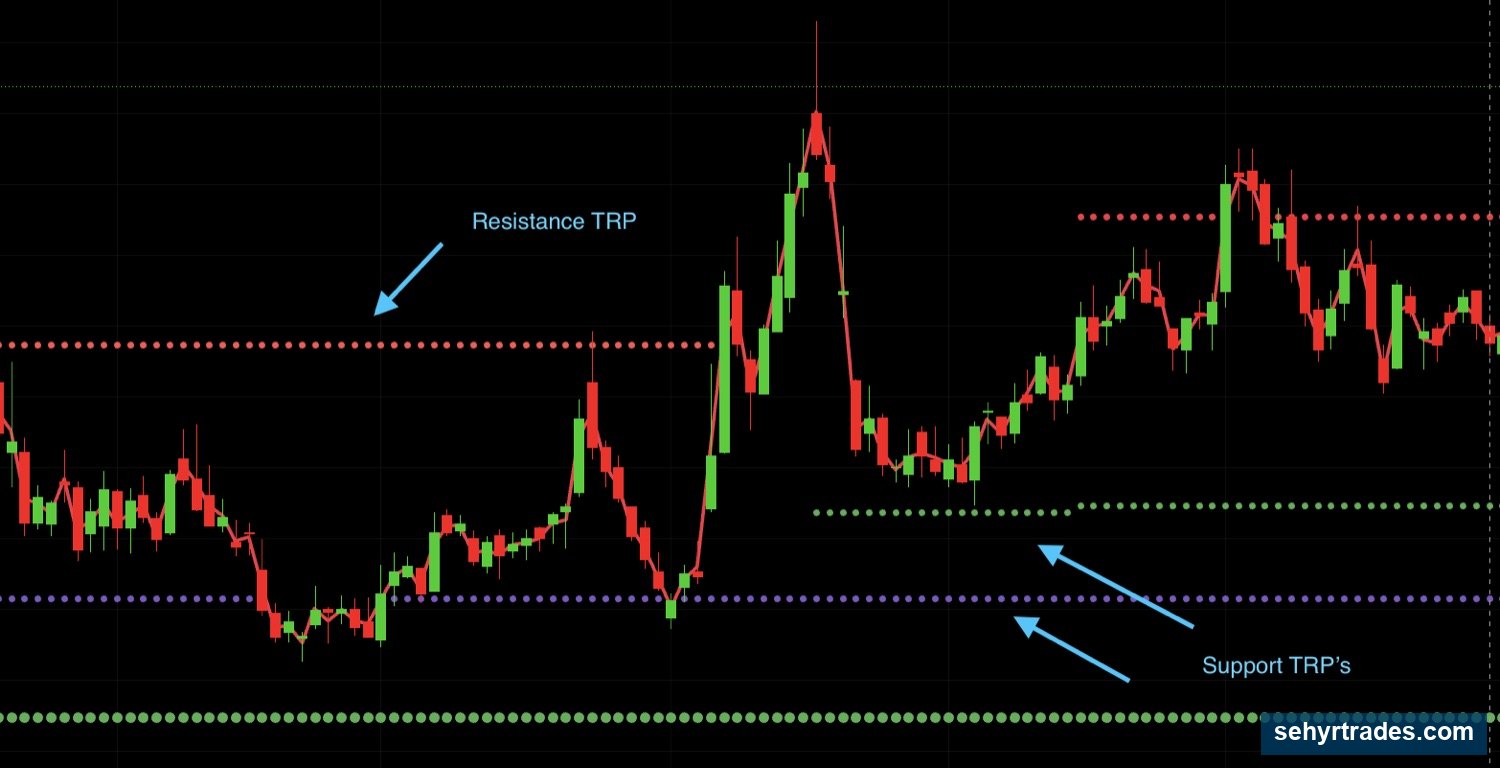
📈 TRP Levels (Trend Reversal Predictor)
TRP stands for Trend Reversal Predictor.
TRP levels are one of the primary tools I use to identify potential support and resistance levels.
Unlike traditional support and resistance, which are drawn from previous highs and lows, TRP levels are calculated using a mathematical formula.
The goal is to identify areas where price may become stretched and where reactions are more likely to occur.
TRP levels are not predictions.
They do not tell us what price will do.
Instead, they identify areas where we should pay closer attention.
Just like support and resistance, price can:
Reject a TRP level
Break through a TRP level
Consolidate around a TRP level
The level itself is not the signal.
The reaction is.
Demark 9s
One concept often associated with TRP levels is the Demark 9.
A Demark 9 occurs when a stock produces nine consecutive qualifying candles according to a specific counting method.
The idea behind the indicator is that trends can become exhausted after extended directional movement.
When a Demark 9 appears near an important level, it can provide additional context that a move may be becoming extended.
A Demark 9 is not a reason to enter a trade by itself.
It is simply another piece of information that can be considered alongside:
Trend
Support and resistance
TRP levels
Market context
How I Use TRPs
I rarely care about a TRP level by itself.
Instead, I look for situations where a TRP level aligns with something else.
For example:
Daily support + TRP
Weekly resistance + TRP
Trendline + TRP
23 EMA + TRP
When multiple factors align together, the area becomes more important.
This concept is known as confluence.
The more reasons price has to react in an area, the more attention that area deserves.
📉 Trendlines
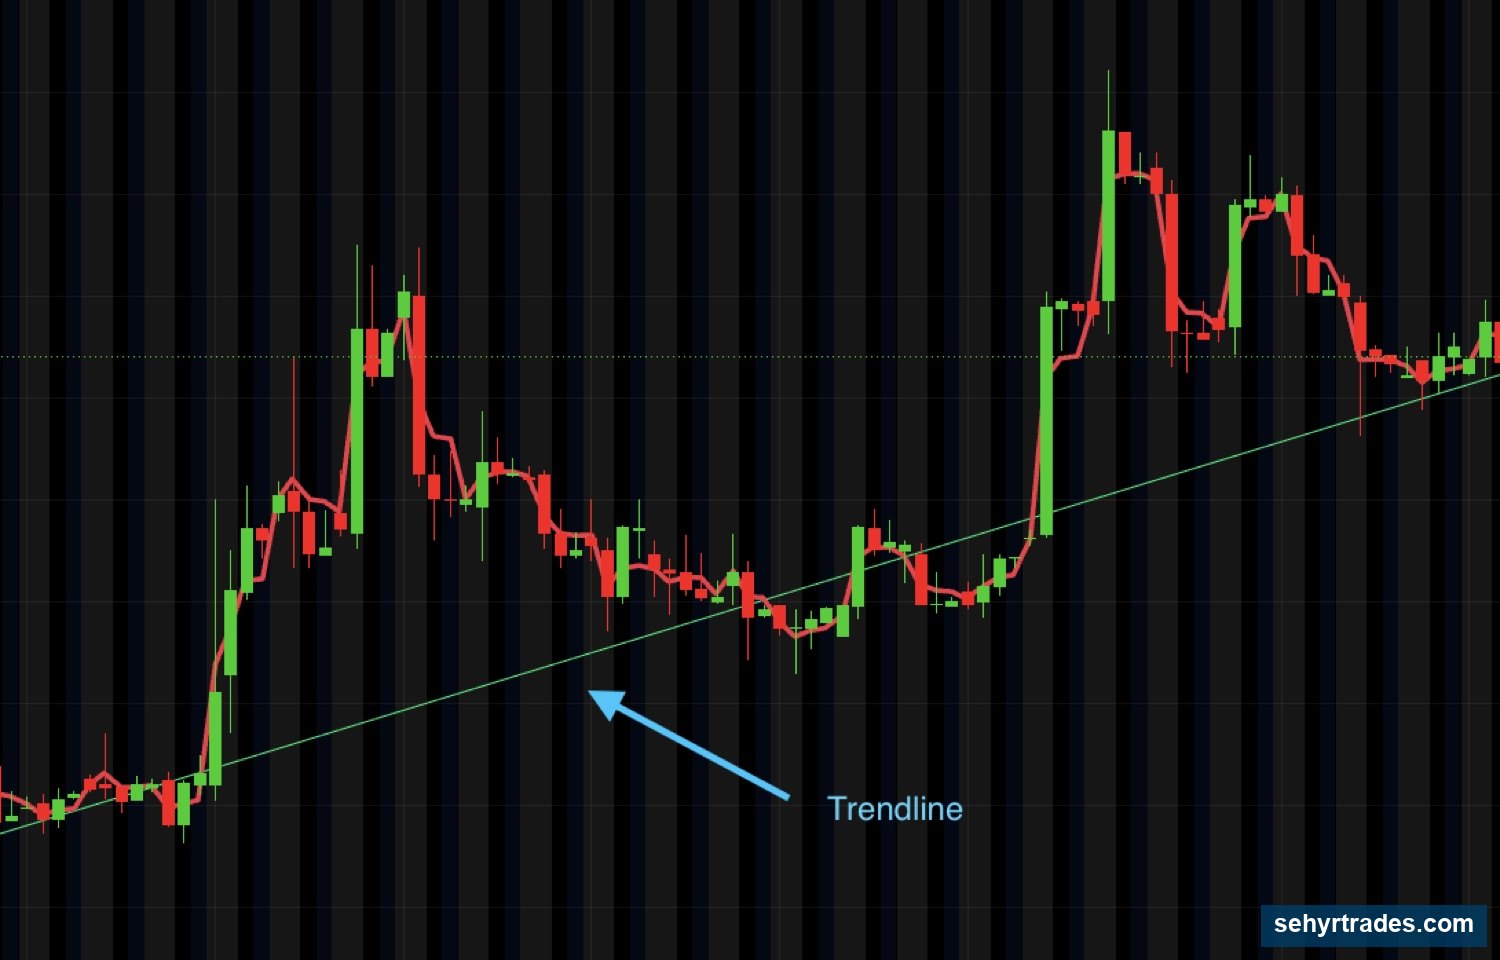
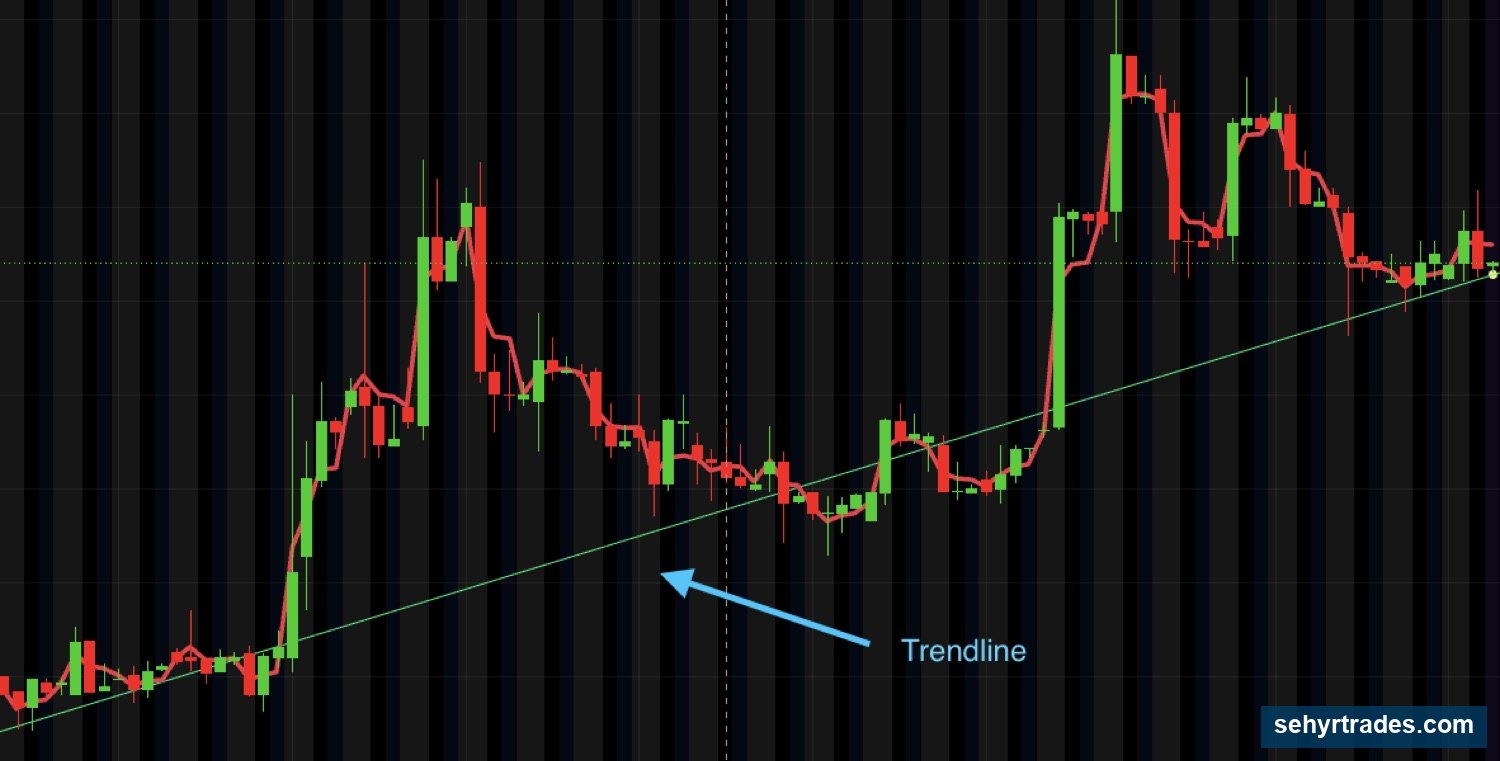
Trendlines are one of the simplest tools available to traders.
A trendline is created by connecting important highs or lows on a chart.
The purpose is not to create a perfect line.
The purpose is to better visualize structure.
Trendlines help answer questions such as:
Is the trend still intact?
Is price respecting support?
Is momentum weakening?
As long as price continues respecting a trendline, the trend may remain healthy.
Repeated failures to hold a trendline can be an early sign that the trend is weakening.
Like support and resistance, trendlines should be viewed as areas rather than exact prices.
📊 Standard Deviation Bands
Standard deviation bands help visualize how far price has moved from its average.
Think of them as measuring extension.
When price is near the middle of the bands, it is closer to its average behavior.
When price pushes toward the outer bands, it may be becoming increasingly extended.
This does not mean price must reverse.
Strong stocks can remain extended for long periods of time.
However, the bands can provide useful context regarding:
Extension
Exhaustion
Potential reaction areas
For this reason, standard deviation bands are best used as a supporting tool rather than a standalone signal.
🧠 Confluence
The most powerful tool is not an indicator.
It is confluence.
Confluence occurs when multiple factors point to the same area.
Examples include:
Daily support + TRP level
Trendline + support zone
23 EMA + support
Standard deviation band + resistance
Weekly level + TRP
When several factors align together, traders often pay closer attention because reactions can become more meaningful.
This does not guarantee a trade will work.
It simply identifies areas where the probability of a reaction may be higher.
Many of the best setups occur when multiple pieces of information align together.
🎯 Key Idea
Tools should support your analysis.
They should never replace it.
Price remains the most important source of information on every chart.
CHAPTER 9: PUTTING IT ALL TOGETHER
By now, you have learned:
* What charts are
* How candlesticks work
* How timeframes interact
* How trends develop
* Where important levels exist
* Common chart patterns
* How to evaluate trade quality
* How trading tools can provide additional context
The goal of this chapter is to combine everything into a single decision-making process.
Many beginners learn concepts individually but struggle to connect them together.
The chart does not care about individual concepts.
Everything is happening at the same time.
As traders, our job is to build a complete picture before making a decision.
Step 1: Start With the Trend
Before looking for a trade, determine the overall direction of the stock.
Ask yourself:
* Is the stock trending higher?
* Is the stock trending lower?
* Is the stock moving sideways?
Remember:
Uptrend:
* Higher highs
* Higher lows
Downtrend:
* Lower highs
* Lower lows
Chop:
* No clear direction
Understanding trend helps establish context before looking for opportunities.
Step 2: Identify Important Levels
Once you understand the trend, identify the levels that matter.
These may include:
* Premarket highs and lows
* Previous day highs and lows
* Support levels
* Resistance levels
* Higher timeframe levels
* TRP levels
Ask yourself:
👉 Where is price likely to react?
This helps identify areas that deserve your attention.
Step 3: Look for Patterns and Structure
Once price reaches an important area, begin evaluating what the chart is showing.
Ask yourself:
* Is price consolidating?
* Is a pattern forming?
* Is price tightening?
* Is momentum increasing?
* Is the chart becoming weaker?
Patterns by themselves do not create trades.
However, they can help provide additional information about what buyers and sellers are doing.
Step 4: Evaluate Trade Quality
Not every chart is worth trading.
Before entering a trade, evaluate:
* Volume
* Float
* Spread
Ask yourself:
* Is there enough participation?
* Is the spread reasonable?
* What type of movement should I expect?
A strong chart with poor trade quality can still create unnecessary risk.
Step 5: Use Tools for Additional Context
Once the chart already looks interesting, trading tools can provide additional confirmation.
Examples include:
* EMAs
* TRP levels
* Trendlines
* Standard deviation bands
Remember:
The purpose of tools is not to create trades.
The purpose of tools is to provide context.
Price remains the most important source of information.
Step 6: Look for Confluence
One of the strongest concepts in trading is confluence.
Confluence occurs when multiple factors point to the same area.
Examples:
* Support + TRP level
* Trendline + support
* 23 EMA + support
* Resistance + standard deviation band
When several factors align together, that area often becomes more important.
The more reasons price has to react, the more attention that area deserves.
🎯 The Goal
Many new traders try to find a single indicator that tells them when to buy and sell.
Professional traders rarely think that way.
Instead, they gather information.
They evaluate:
* Trend
* Levels
* Patterns
* Trade quality
* Tools
Then they make a decision based on the complete picture.
No single factor determines a trade.
It is the combination of factors that creates confidence.
Trade it with us.
Inside the room you get the live day and swing alerts with the exact entry, stop and targets, a daily watchlist, the halal scanners and the trade reviews.
Join premiumSehyr Trades is an educational community. Nothing here is financial advice, a recommendation, or a solicitation to buy or sell any security. Trading involves risk, including loss of capital. Always do your own research.