
☀️ Small Cap Day Trading Playbook
Overview
Before you get started, please make sure you've reviewed the #tradingview-template-and-indicators channel so that you are able to follow along on some of the indicators mentioned.
This playbook corresponds to this channel: #sc-momentum-day-alerts🔥.
TREND-ALIGNED PLAYBOOK (HIGHER TIMEFRAME ALIGNMENT)
Alert channel: #sc-momentum-day-alerts🔥
WHAT THIS STRATEGY IS
Trading halal small-cap stocks that are already trending and have room to continue on multiple timeframes.
These are still momentum trades — just cleaner. All trades are based on higher timeframe trend (1H, 4H, and Daily).
THE TYPE OF STOCKS WE TRADE
We are looking for halal stocks that:
- Are already moving
- Have strong volume
- Have clear structure
- Have room on the chart
Most importantly: Room on the 4H and Daily timeframes. We also look at 30 min and 1H charts for additional context.
HOW THIS DIFFERS FROM HIGH-RISK MOMENTUM
The difference is what stage of the move we're entering.
High-risk momentum trades:
- Fast
- Extended
- Less structure
- Entering during the initial spike
Trend-aligned trades:
- Wait for confirmation
- Avoid extended entries
- Focus on cleaner setups
- Entering AFTER the move sets up — not during chaos
👉 Both are valid. Trend-aligned is suited for newer traders. Momentum requires more experience.
THE 5-STEP CHECKLIST
Before entering any trend-aligned setup, we verify all 5 steps below.
1️⃣ STEP 1: CHECK THE RANGE FIRST
Does the stock have room to move?
✅ What we want:
- Clear upside on the chart
- Volume increasing
- Not bumping into resistance
❌ Avoid:
- Extended charts (already moved a lot)
- Sitting at obvious resistance
- Downtrending on 4H / Daily
- Choppy, directionless price action
2️⃣ STEP 2: HIGHER TIMEFRAME CONTEXT
Check BOTH the 4-Hour Chart and Daily Chart for:
- Clean structure (higher highs and higher lows)
- Room to run before major resistance
- No major resistance directly above
- Trend supportive (not breaking down)
If 4H and Daily don't align, the setup is not trend-aligned. Skip it.
3️⃣ STEP 3: STANDARD DEVIATION LEVELS
We use the Standard Deviation Channel on our chart to gauge extension.
- Avoid stocks trading above the upper standard deviation (extended)
- Prefer stocks with room for expansion within the channel
- Stocks at the upper band often pull back before continuing
(For more on the Standard Deviation Channel see #tradingview-template-and-indicators)
4️⃣ STEP 4: TRENDLINE / STRUCTURE
Look for structure you can trade off:
- Trendline support holding
- Higher lows forming
- Clean pullback structure
- Key levels respecting (9 EMA, 23 EMA, prior highs)
If there is no clear structure, there is no clear stop. Skip the trade.
5️⃣ STEP 5: ENTRY ON 1-MINUTE CHART
Once steps 1-4 are clean, we drop down to the 1-minute chart for entry timing.
We wait for confirmation — we do not anticipate the move.
Confirmation can look like:
- A clean reclaim of a key level
- Strong volume on a breakout
- A pullback that holds and resumes higher
If price keeps chopping or fails to confirm, do not force the trade.
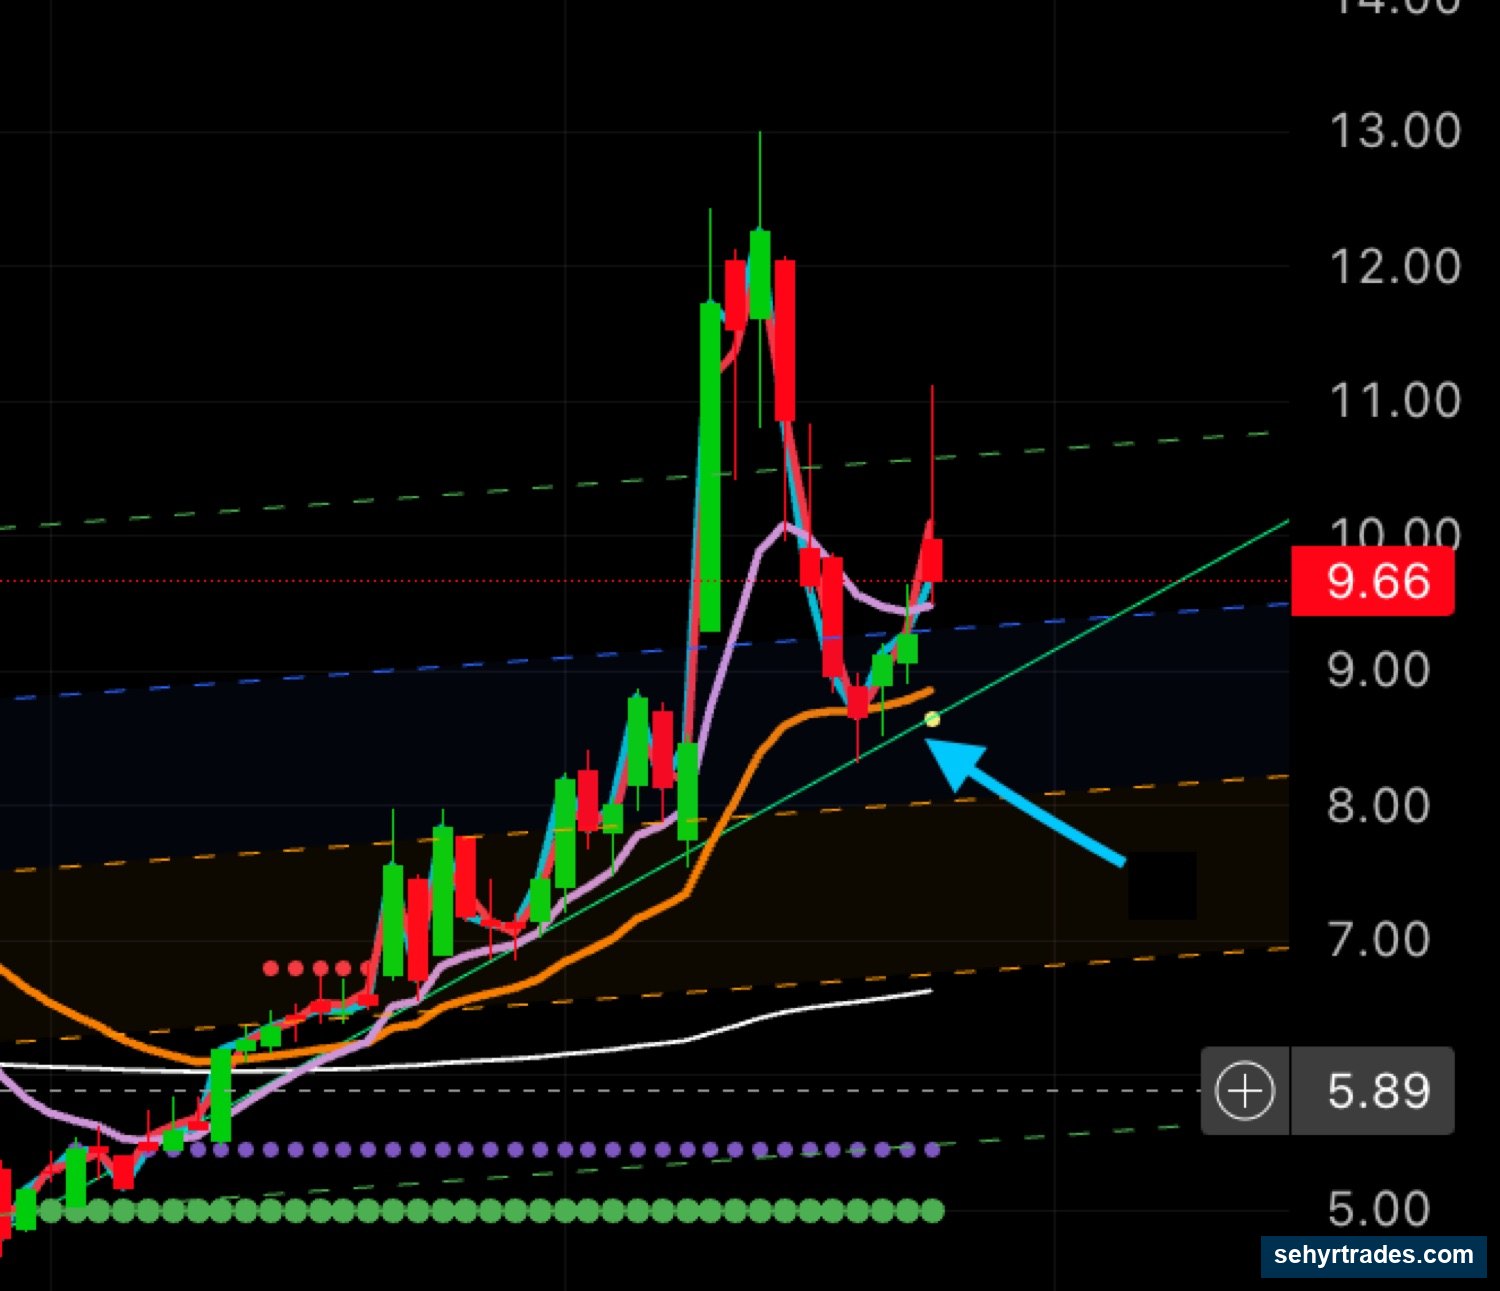
Here's an example on the stock CRML:
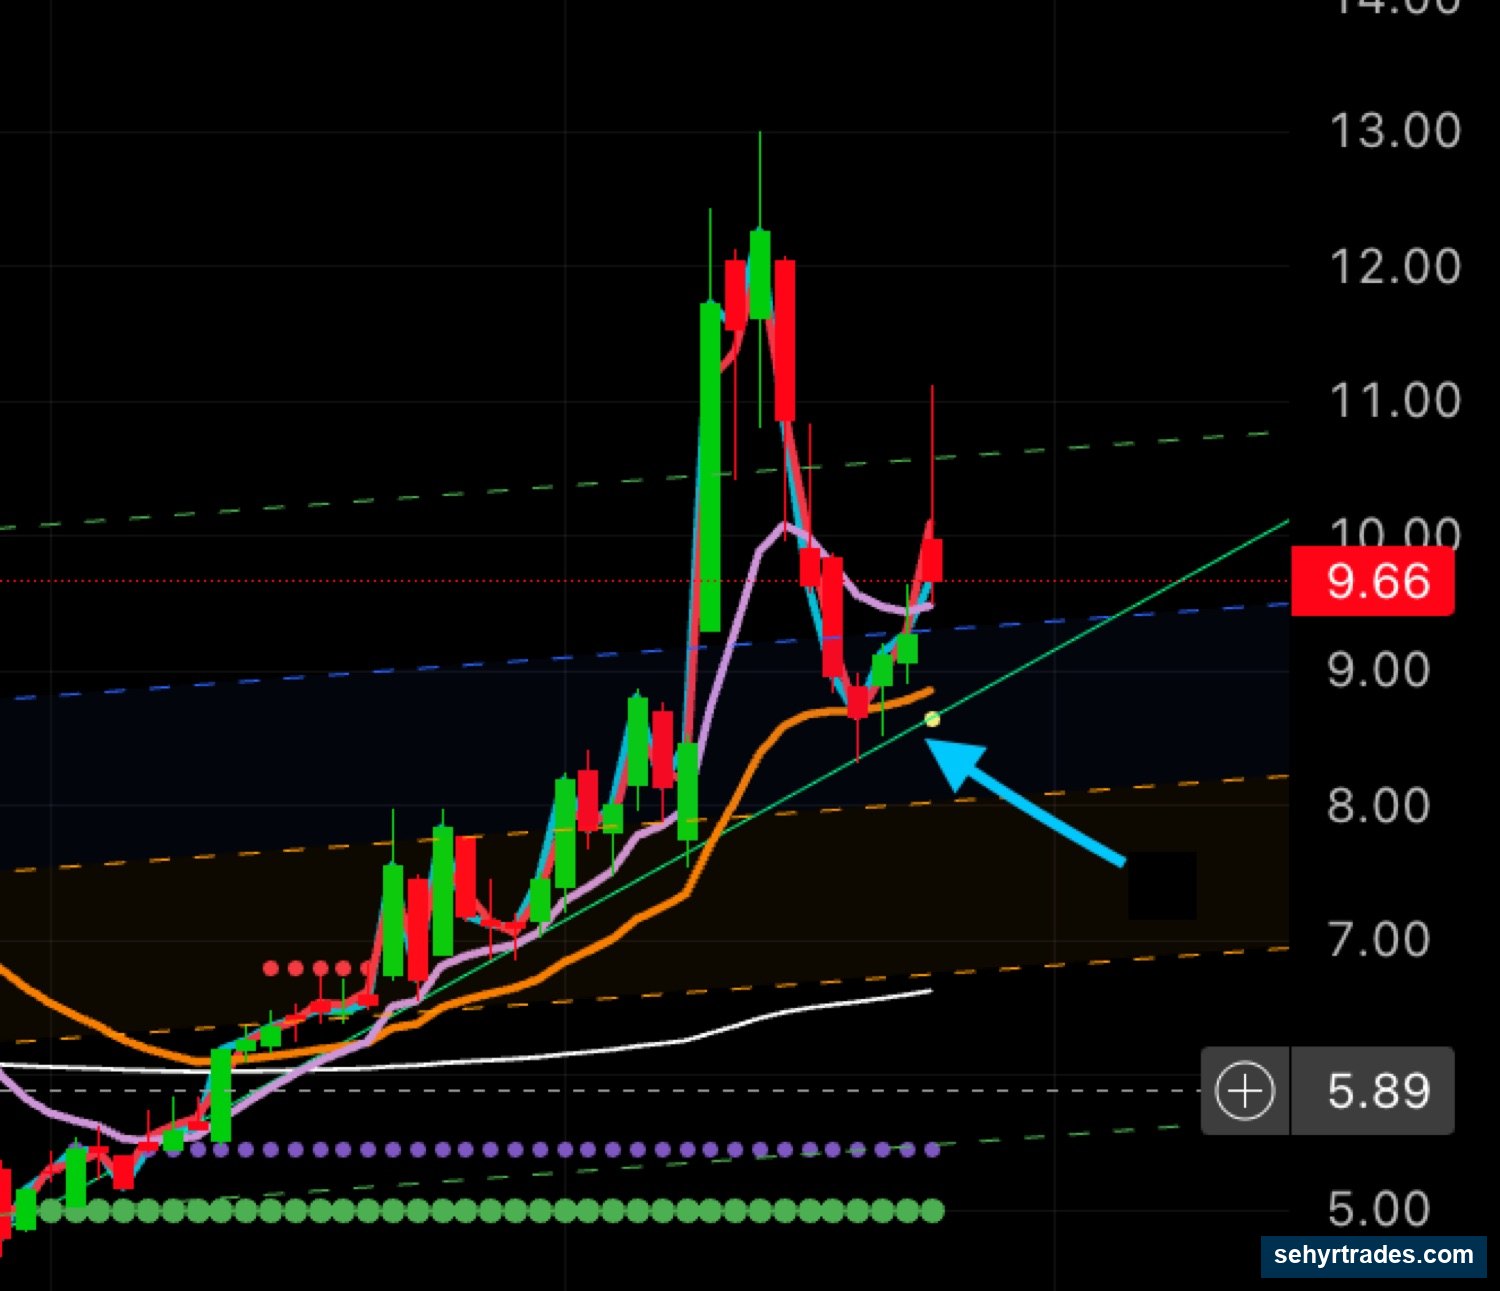
This is the daily chart which shows a really clean pullback to the 23 EMA and bounce off the trendline as well.
Here is the same ticker on the 4 hour chart with a clean bounce off the trendline, consolidation and signs of reversal.
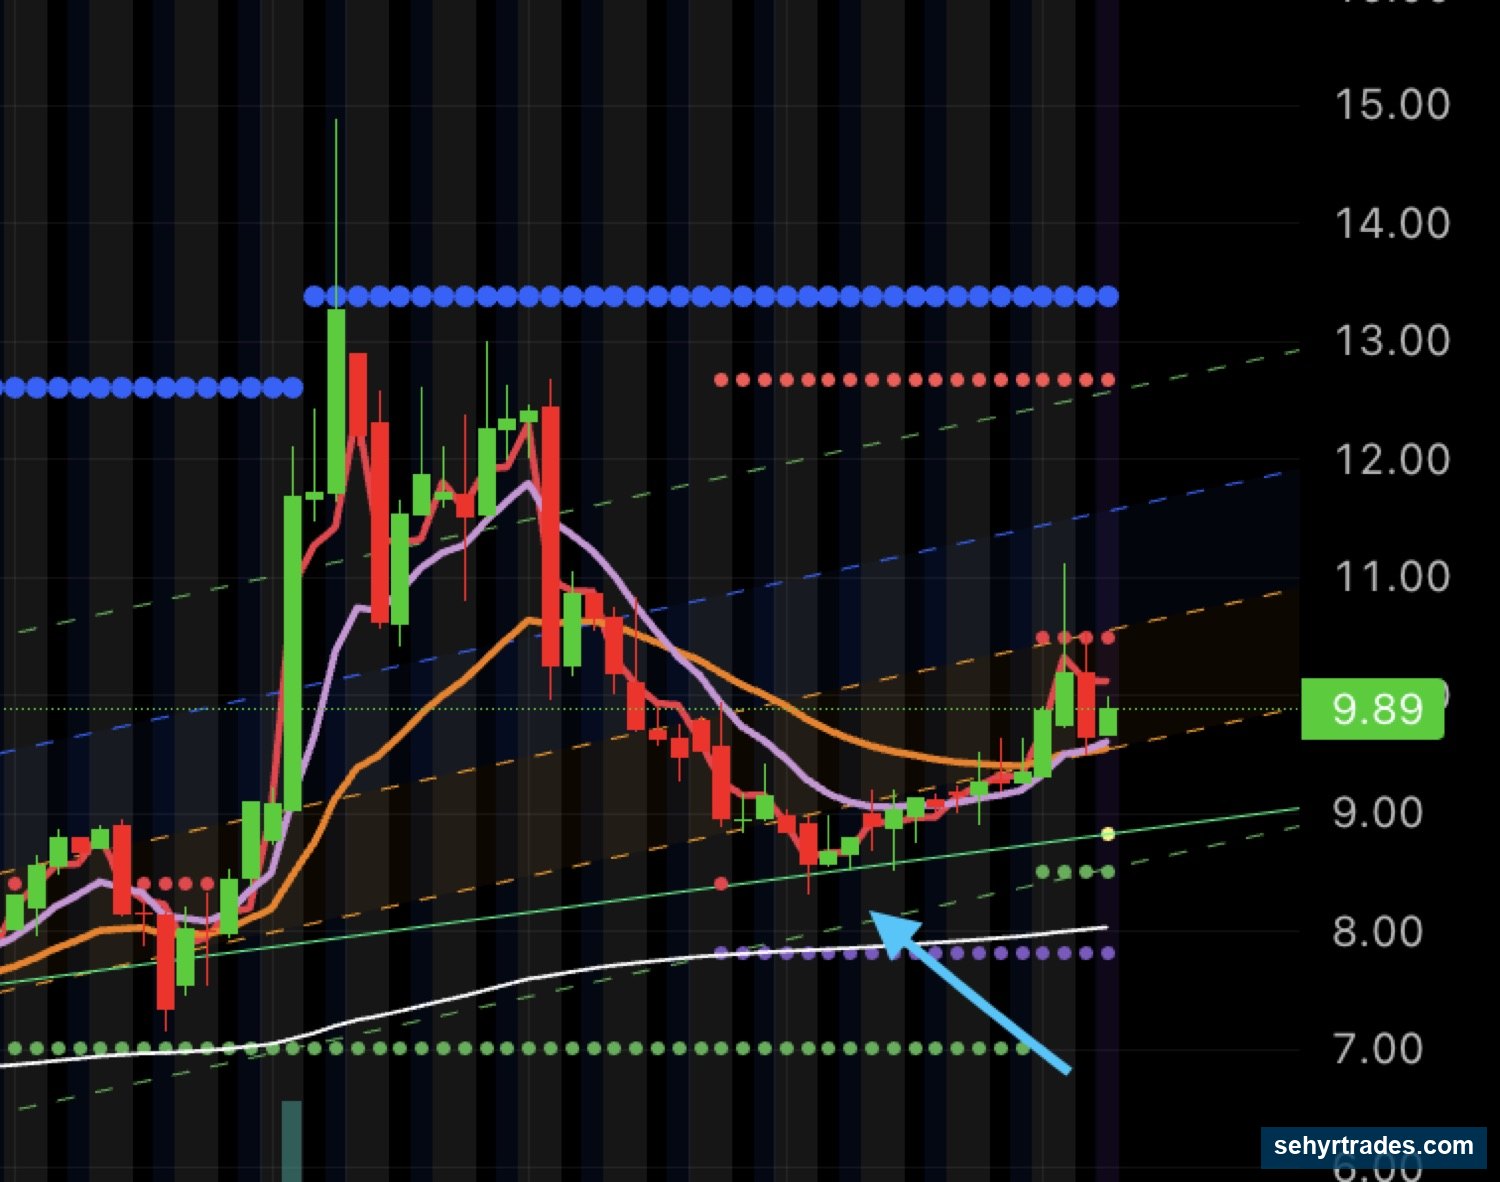
As you can see, going through the 5 step checklist:
1, yes the stock has room to run up until resistance (the red and blue dotted lines or TRP) as well as the top of the standard deviation channel (the green dashed line)
2, the stock looks great on the 4 hour chart and the daily chart (if you can't tell what's happening on the 4 hour chart, you can look at a 1 hour chart as well for more information)
3, the stock is not at the top of the standard deviation channel (the top is the dashed green line).
4, We see perfect bounces off the trendline on both the 4 hour and daily chart and the chart is respecting the 23 EMA on the daily.
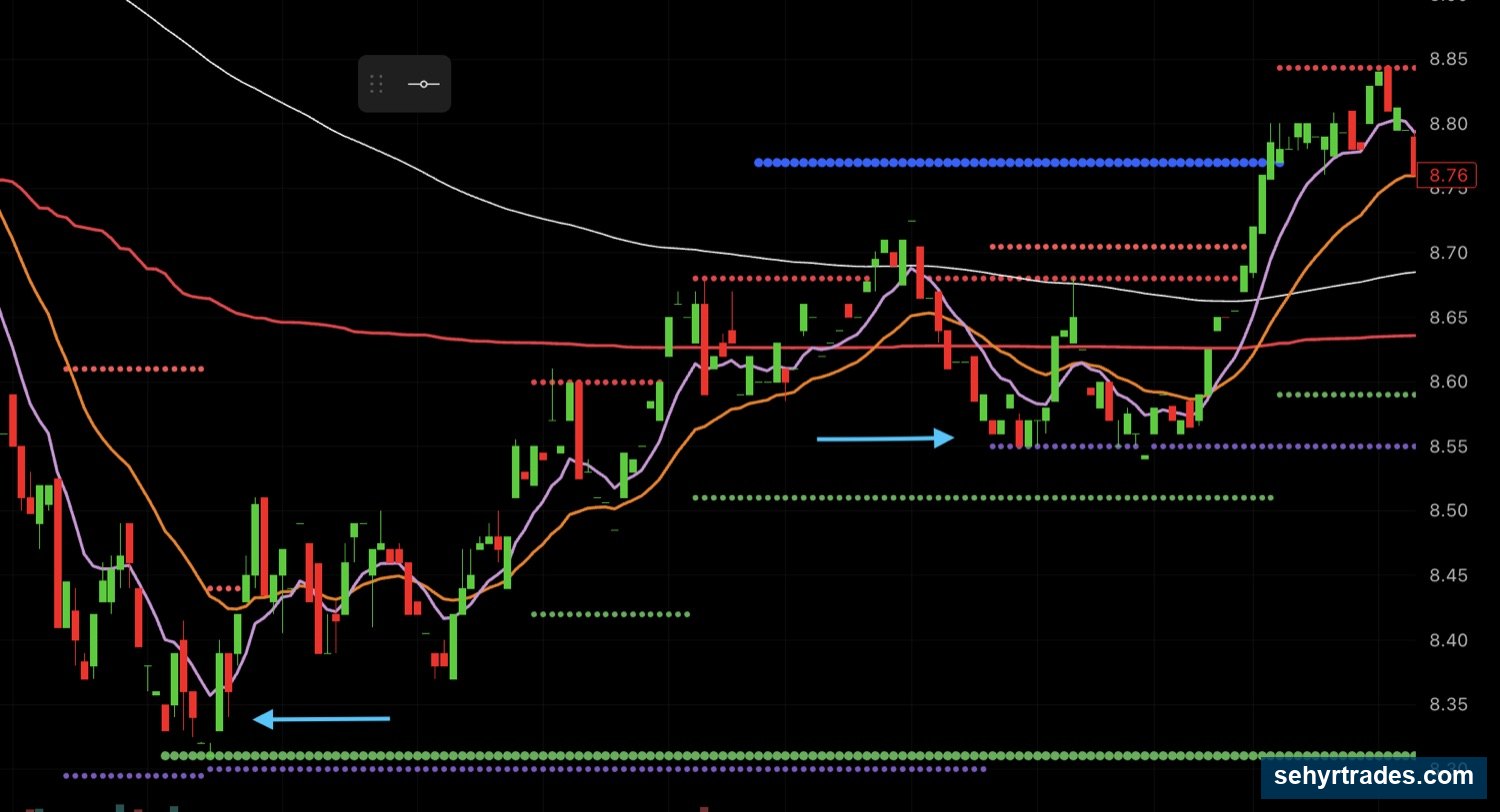
5, the last part would be to look for a 1 minute entry on this day which we could look for similarly by looking at levels at support.
Notice the multiple bounces off support (the green and purple dotted lines, or TRP)
ENTRY TYPES
Once the 5-step checklist is satisfied, entries usually fall into one of two types.
1️⃣ CONTINUING TREND OR BREAKOUT
- Break of intraday high
- Strong volume confirmation on the break
- Price holds above the breakout level
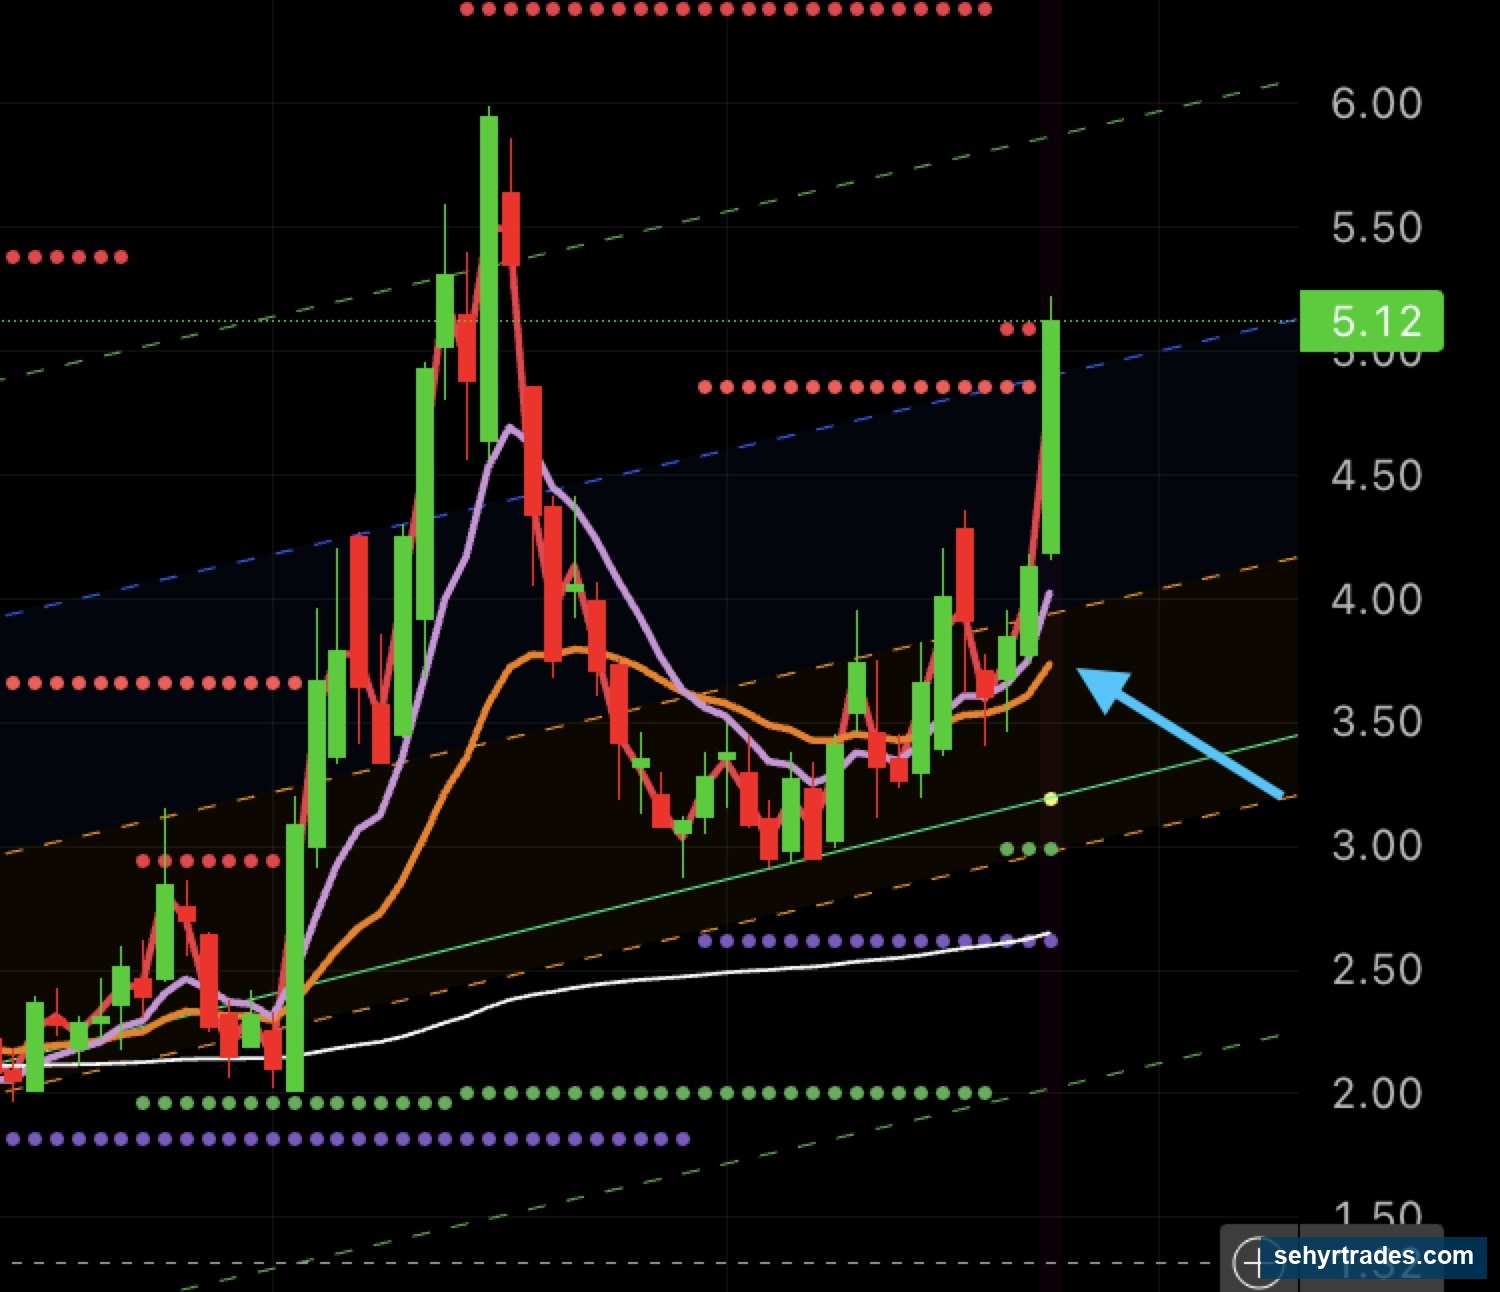
This is the more aggressive entry. Best when the higher timeframe is clearly trending up and intraday structure is supportive.
Here is an example on daily chart of SIDU where you see the EMA's curl up sharply for a trend continuation and breakout.
2️⃣ PULLBACK CONTINUATION
- Pullback into support (trendline, 9 EMA, 23 EMA, or prior level)
- Holds structure on the pullback
- Continuation move on strong volume
This is the more controlled entry. Better risk/reward because you're entering on the dip, not the spike.
The CRML example we did earlier is an example of a pullback continuation.
Here is the daily chart again.
STOP LOSS & RISK MANAGEMENT
Every trend-aligned alert includes a defined stop loss based on chart structure.
Standard approach:
- Risk 1% of your account per trade
- Stop is placed below structure (trendline, pullback low, or key EMA)
- Stop distance is typically wider than momentum trades because we are trading higher timeframe structure
POSITION SIZING (Risk-Based)
Step 1: Decide your risk
Risk 1% of your account per trade.
Examples:
- $5,000 account → risk = $50 per trade
- $10,000 account → risk = $100 per trade
Step 2: Identify your stop distance
The stop is placed at the structural invalidation level (where the setup is no longer valid).
Trend-aligned stops typically range $0.30 – $0.80 because structure is wider.
Step 3: Calculate your shares
Formula:
Shares = Risk ÷ Stop Distance
Example:
- Account = $5,000
- Risk = $50
- Entry = $10
- Stop = $9.50 (below pullback low)
- Stop distance = $0.50
- Shares = $50 ÷ $0.50 = 100 shares
If the trade fails → you lose ~$50
If it works → you scale out into strength
Summary:
- Small stop = more shares
- Large stop = fewer shares
- Risk always stays the same
(Full position sizing math: Risk & Execution Lesson 2)
BECAUSE THESE MOVE SLOWER BUT CAN TEND TO WICK, WE DO NOT KEEP HARD STOPS UNLESS SPECIFIED
- We put alerts at the stops to see how the level reacts
- For trend-aligned, since these are typically already moving, to stay safe we typically do only add to a position before we let it stop out.
- Respect the stop, take the small loss, move on.
This is the single most important rule. One ignored stop can erase weeks of disciplined trades.
T1 AND T2 (PROFIT TAKING)
Every alert includes T1 (1R target) and T2 (2R target).
T1 = 1R = your risk amount in profit
T2 = 2R = double your risk in profit
Example:
- Entry $10, Stop $9.70
- Risk per share = $0.30
- T1 = $10.30 (+$0.30 = 1R)
- T2 = $10.60 (+$0.60 = 2R)
STANDARD APPROACH
- Take partial profit at T1 (locks in your risk amount as profit)
- Move your stop UP to T1 once T1 hits (locks in at least +1R minimum)
- Hold the remainder of the position toward T2
- Or trim manually into strength if momentum slows before T2
This converts a winning trade into a "free" trade after T1 — worst case becomes +1R, not breakeven.
WHAT TO AVOID
- Entering after the move has already extended
- Buying directly into resistance
- Ignoring volume confirmation
- Entering before the 5-step checklist is satisfied
- Overtrading multiple setups in one day
- Skipping the stop loss
- Adding to a losing position
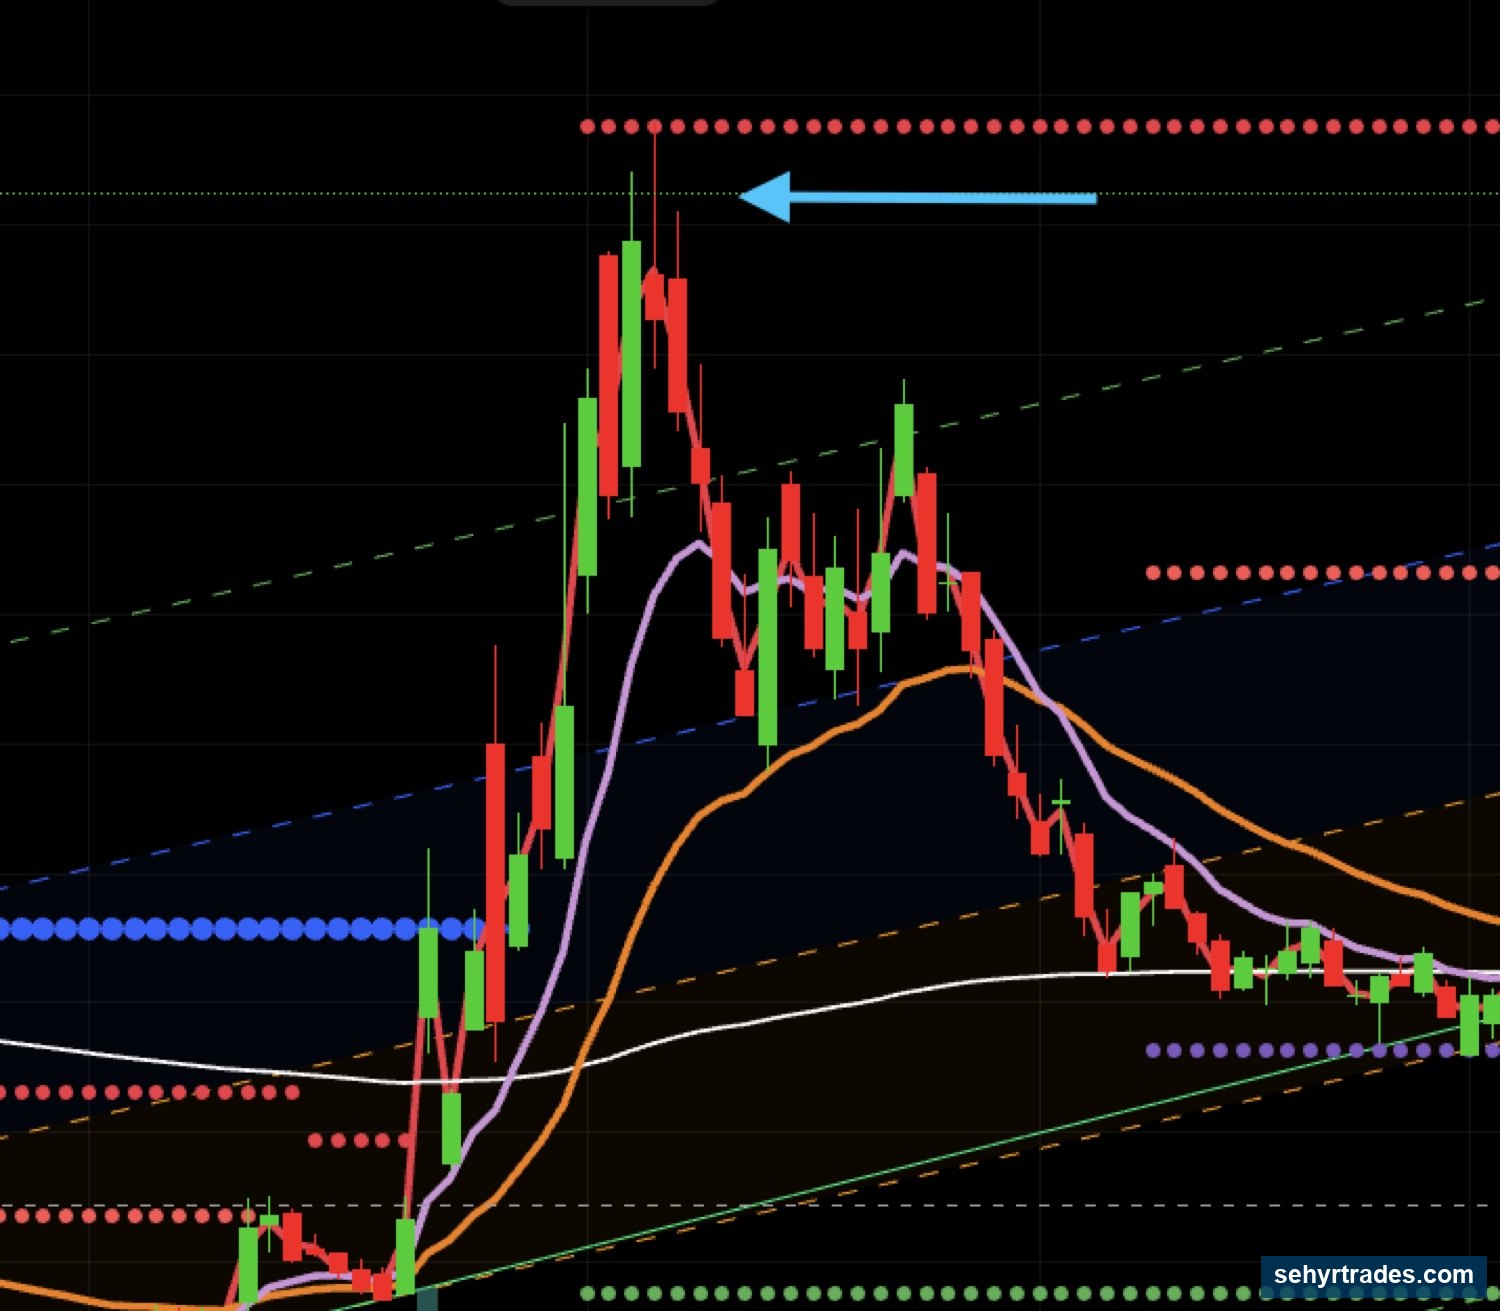
Here is the same chart of SIDU showing a different area of the chart, where resistance is being hit (hitting the red dotted lines at TRP). In addition, you can see extension of the candles moving away from the 9 EMA.
FULL STRATEGY CHECKLIST (BEFORE ENTRY)
Use this as a real checklist in real time:
☐ Room to move on 4H and Daily?
☐ Not at major resistance?
☐ 4H + Daily aligned?
☐ Not above upper standard deviation (extended)?
☐ Clean structure (trendline / pullback) visible?
☐ Strong volume present?
☐ Clean 1-minute setup forming?
☐ Stop loss defined and accepted?
If all yes → take the trade
If any no → wait or skip
The discipline of going through this checklist is what separates trend-aligned from random entries.
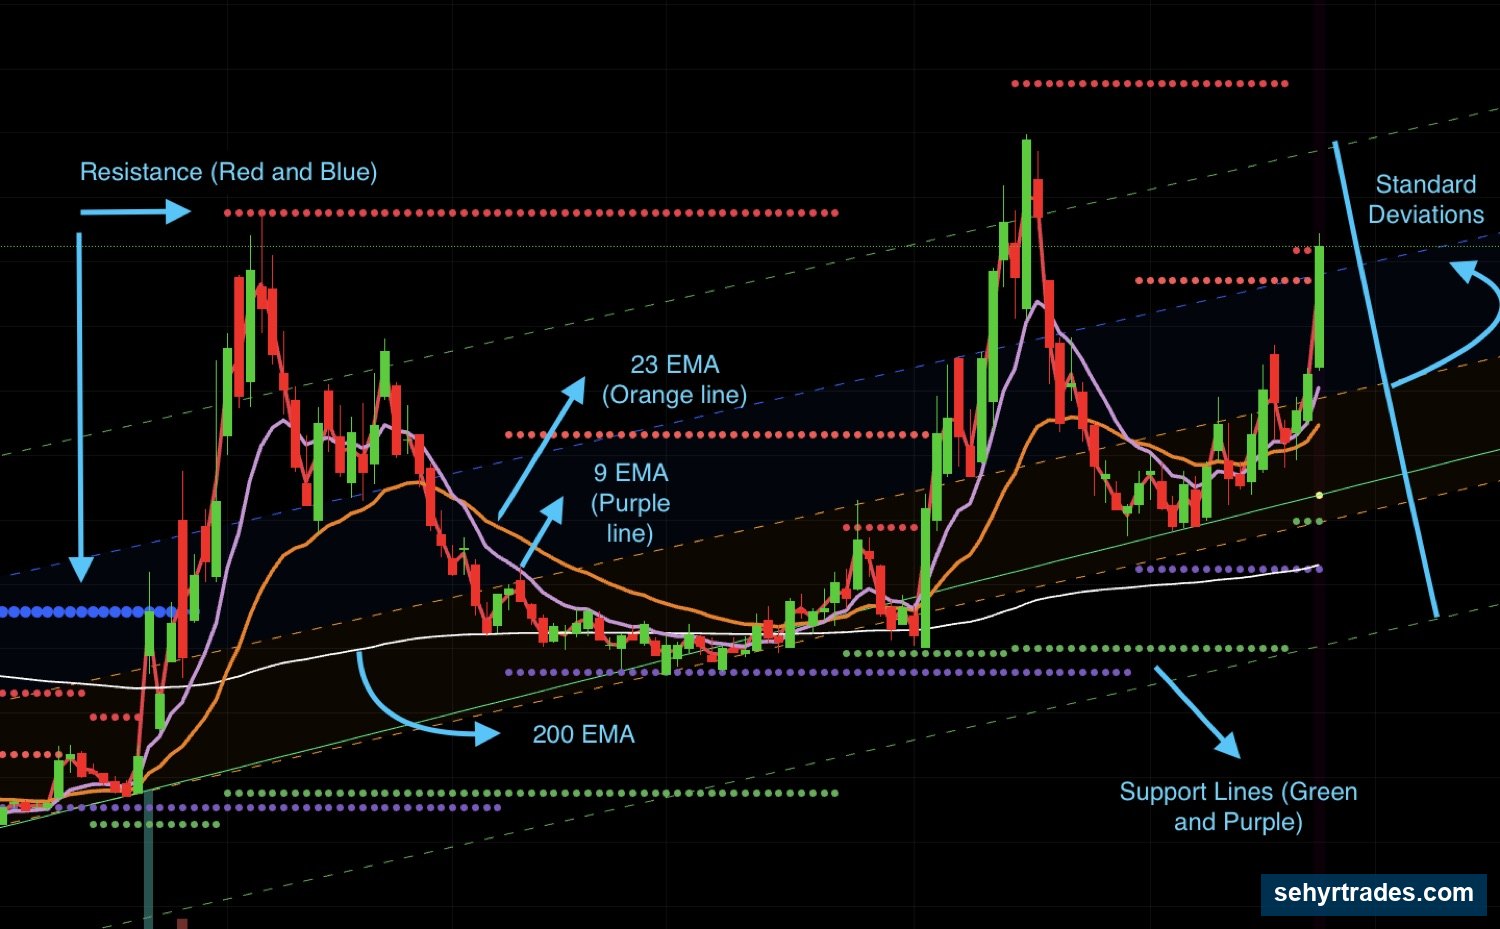
Also as a reminder, please reference #tradingview-template-and-indicators if you need help with the indicators that are being referenced. Here's a quick key as well (volume, MACD and RSI are already readily seen on the template chart).
.
Trade it with us.
Inside the room you get the live day and swing alerts with the exact entry, stop and targets, a daily watchlist, the halal scanners and the trade reviews.
Join premiumSehyr Trades is an educational community. Nothing here is financial advice, a recommendation, or a solicitation to buy or sell any security. Trading involves risk, including loss of capital. Always do your own research.