
⏳ Small Cap Swing Trading Playbooks
SMALL CAP SWING TRADING PLAYBOOKS
Before you get started, please make sure you've reviewed the #tradingview-template-and-indicators channel so that you are able to follow along with the indicators mentioned.
This channel covers our 6 swing trading setups that you'll see in the alert channel below:
🚨 Alert channel: #sc-trend-swing-alerts🔥
The 6 setups are:
📈 Trend
📉 Pullback
⚡ Snap Back
🔁 Reversal
📊 Channel
🚀 Expansion
Each setup is explained in detail below. Read all of them before taking any swing alerts so you know what type of setup each alert is and how to manage it.
Swing trades are typically held for multiple days. They require patience, structure, and discipline through pullbacks.
.
WHAT IS SWING TRADING
Swing trading is holding a stock for multiple days to capture a larger move that day trading cannot.
Where day trades close the same session, swing trades may hold for:
- 2-3 days
- A week
- Sometimes longer if structure stays intact
HOW SWING DIFFERS FROM DAY TRADING
Day Trading:
- In and out same session
- Reacting to intraday momentum
- Faster execution
- No overnight risk
Swing Trading:
- Holds multiple days
- Trades higher timeframe structure
- Requires patience through normal pullbacks
- Carries overnight risk (news, dilution, gaps)
👉 Swing trading is about catching the bigger move while day trading captures the smaller intraday push.
THE TYPE OF STOCKS WE SWING
We are looking for halal small caps that:
- Have a real higher timeframe trend or pattern
- Have strong volume confirming the move
- Have clean structure (not choppy)
- Have catalyst, recent runner status, or sector strength
We trade off Daily and 4H structure primarily, with 1H for refinement.
OVERNIGHT RISK IS REAL
Small caps can:
- Gap down on news, dilution announcements, or offerings
- Be halted overnight (rare but happens)
- Reverse hard on bad market open
This is why position sizing matters even more for swings than for day trades. Your stop may not protect you on an overnight gap.
Risk no more than 1% per trade regardless of how good the setup looks.
THE 6 SWING SETUPS
Each swing alert is labeled with one of these 6 setup types. Each has its own characteristics, ideal entry, and management approach.
📈 Trend — Multi-day uptrend continuation, holding the 9 EMA as support
📉 Pullback — Dip into the 21 EMA or key horizontal support, wait for strength
⚡ Snap Back — Sharp drop wicking off support and bouncing, fast entry
🔁 Reversal — Trendline bounce against the prior trend, with follow-through
📊 Channel — Range trade between defined support and resistance
🚀 Expansion — Breakout out of tight consolidation, rising 9 EMA slope
Each is detailed below.
.
SETUP #1: TREND
WHAT IT IS
A multi-day uptrend continuation play.
The stock is already trending up, respecting the 9 EMA as dynamic support, and we want to ride the existing trend.
This is one of our cleanest setups because the trend is already proven.
WHAT YOU SEE ON THE CHART
- Multiple days of higher highs and higher lows
- Price holding above the 9 EMA on the daily
- Pullbacks are shallow and quick
- Volume holding up on continuation candles
WHEN TO TAKE IT
- When price respects the 9 EMA on a small pullback and resumes higher
- Confirmation candle (green close above the 9 EMA after a dip)
- Volume returning on the continuation
STOP PLACEMENT
Structural:
- Below the recent swing low
- OR below the 9 EMA itself (if structure is tight)
- Always defined by structure, not by a random dollar amount
TARGETS
- T1 (1R) on continuation strength
- T2 (2R) if trend keeps holding
- Trail with the 9 EMA if it really runs
COMMON MISTAKES
- Entering when price is far extended from the 9 EMA (chasing)
- Skipping the pullback wait and buying at the top of a candle
- Holding through a clear 9 EMA break (that's your invalidation signal)
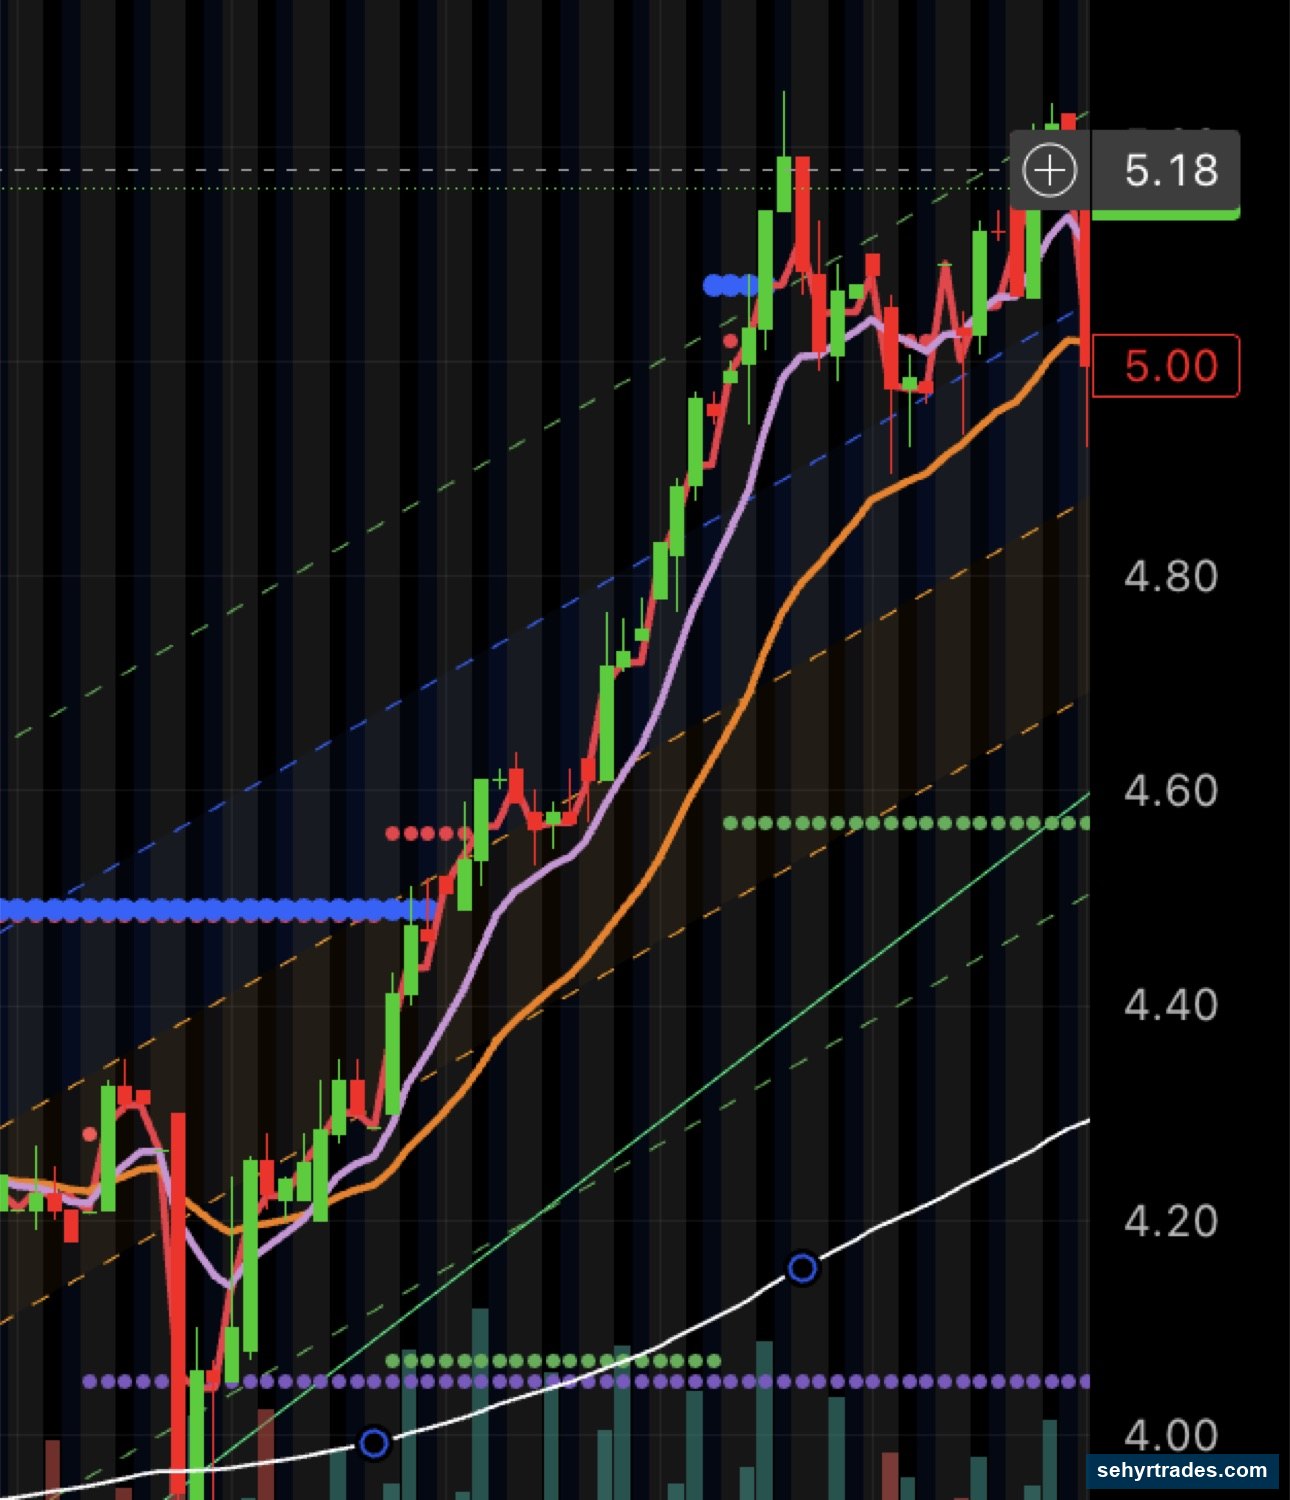
This 4 hour chart of BTE is an example of a strong trend respecting the 9 EMA (purple line) closely. These can be traded at the pullbacks to the EMA continuing to ride the trend and moving your stop as the trend continues.
SETUP #2: PULLBACK
WHAT IT IS
A trending stock pulls back to a key support level (usually the 21/23 EMA or a horizontal level), holds, and resumes higher.
The trend is intact — we just want a better entry than chasing the breakout.
This is one of our highest reward-to-risk setups because the stop is tight and the upside is the full move.
WHAT YOU SEE ON THE CHART
- Stock was trending up
- Pulled back to the 21/23 EMA OR a clean horizontal support level
- Pullback was controlled (not a panic flush)
- Buying showing up at the support
WHEN TO TAKE IT
- Price tags 21/23 EMA or key horizontal support
- Forms a higher low or holds the level
- Confirmation candle showing strength returning
- Volume showing buyers stepping in
STOP PLACEMENT
Structural:
- Below the pullback low
- OR below the support level being tested
TARGETS
- T1 (1R) on first thrust higher
- T2 (2R) if pullback was bought with conviction
COMMON MISTAKES
- Entering at the top of a pullback before it actually pulls in
- Buying a "pullback" that's actually a trend break
- Ignoring volume — pullback bought with weak volume often fails
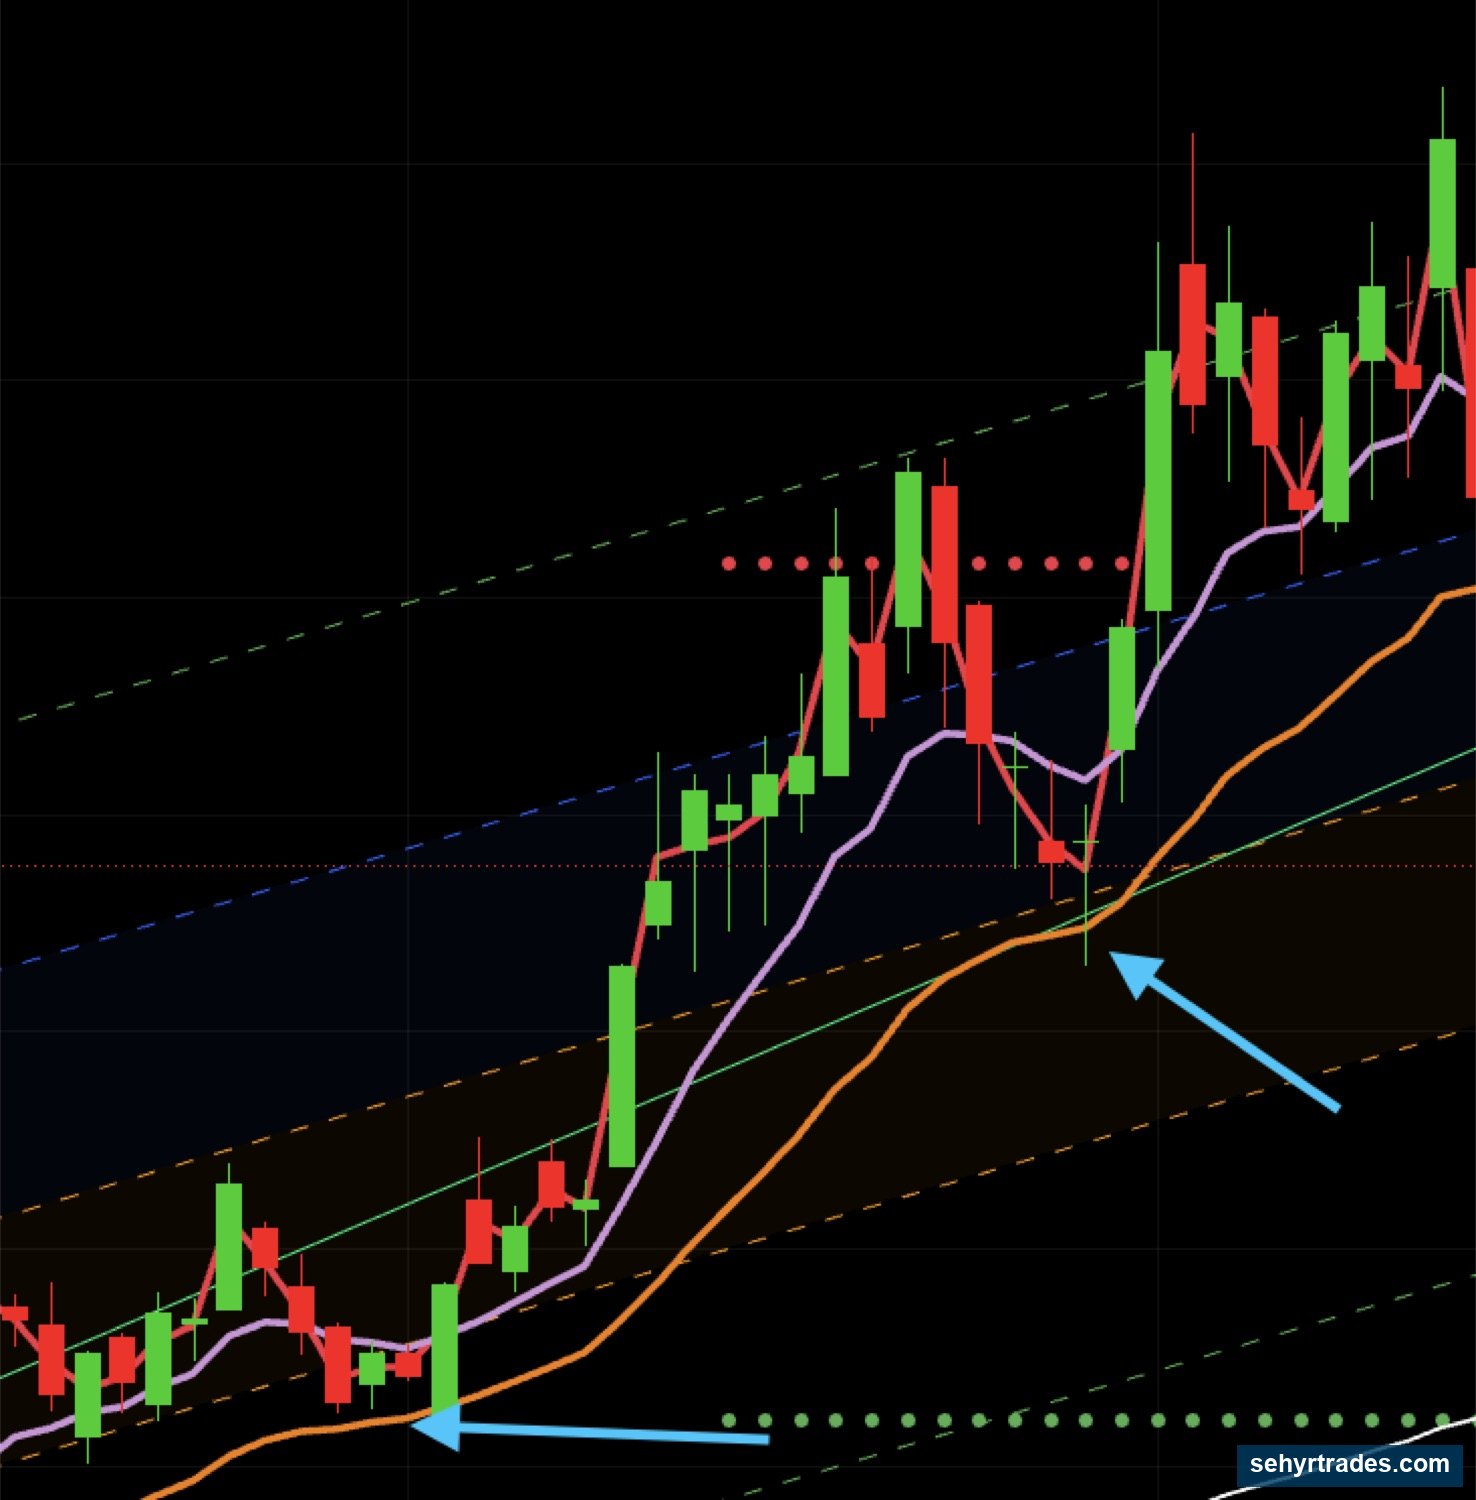
These are some examples of pullbacks, in this case they are pullbacks to the 23 EMA (but it could be the 9 EMA or a another support line).
SETUP #3: SNAP BACK
WHAT IT IS
A sharp drop that wicks below key support (typically the 200 EMA) and bounces aggressively.
This is the most aggressive of our swing setups. We are catching a sharp reversal at a key level, looking for a quick snap back in price.
⚠️ Higher risk than trend or pullback because we are buying weakness, not strength.
WHAT YOU SEE ON THE CHART
- Sudden sharp drop on the chart
- Wick below a key support level (prior swing low, key EMA, or horizontal)
- Strong reversal candle (long lower wick, body closing back above support)
- Volume spike on the wick AND on the bounce
WHEN TO TAKE IT
- Reversal candle confirms (closes back above the level wicked)
- Bounce is on real volume, not just a slow drift up
- Higher timeframe is not actively breaking down
STOP PLACEMENT
- Below the wick low of the snap back candle
- Tight stops here because if it goes back below, the setup failed
TARGETS
- T1 (1R) is the priority — these are fast moves that can reverse quickly
- Take profit aggressively at T1, runners are bonus
- Snap backs often don't make it to T2 — treat T1 as the main goal
COMMON MISTAKES
- Catching a falling knife with no reversal candle confirmation
- Holding too long expecting a full reversal (snap backs are short-term plays)
- Sizing too big because it "feels" oversold
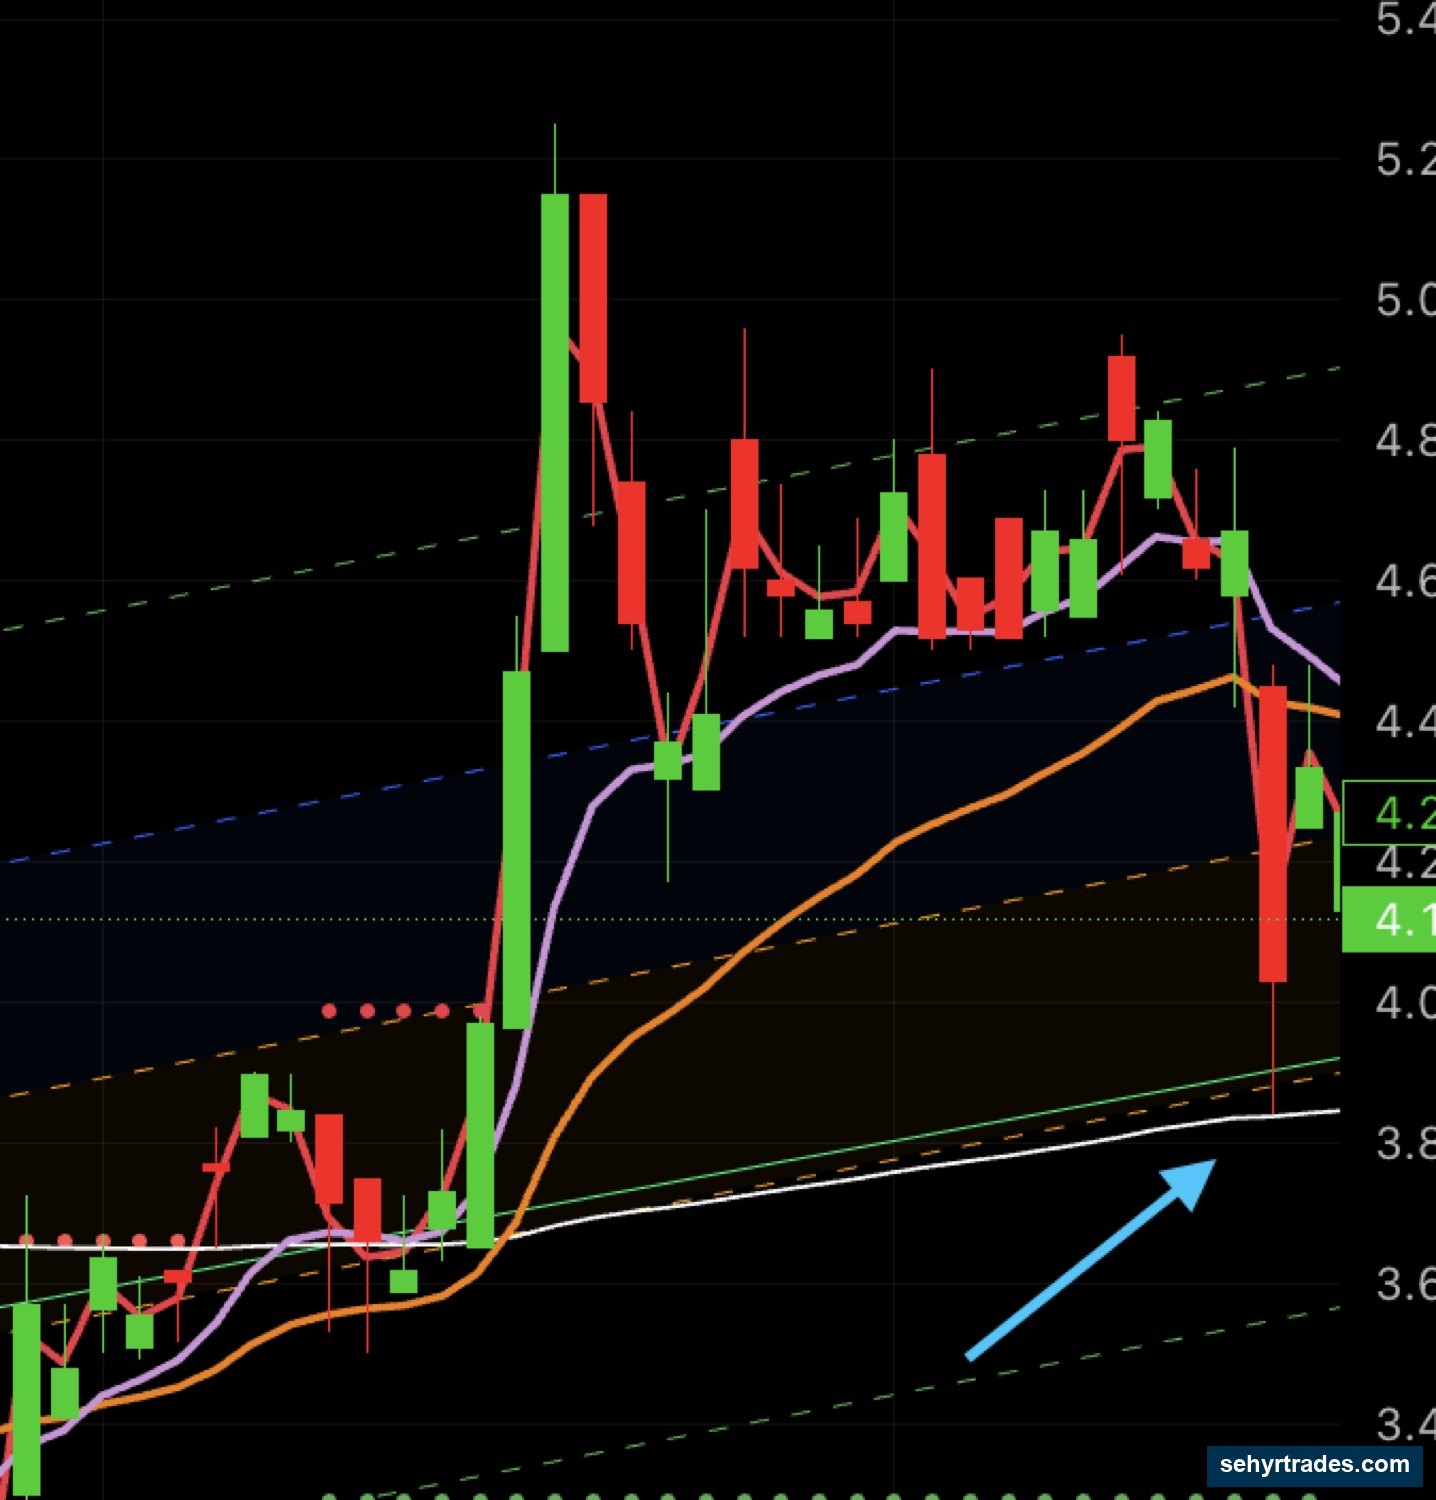
Here are a few examples. This first chart is ATHE where you can see a perfect wick to the 200 EMA (the white line), these are typically quick bounce backs and may retest in the next few sessions. The idea is buying at the wick and selling at the bounce.
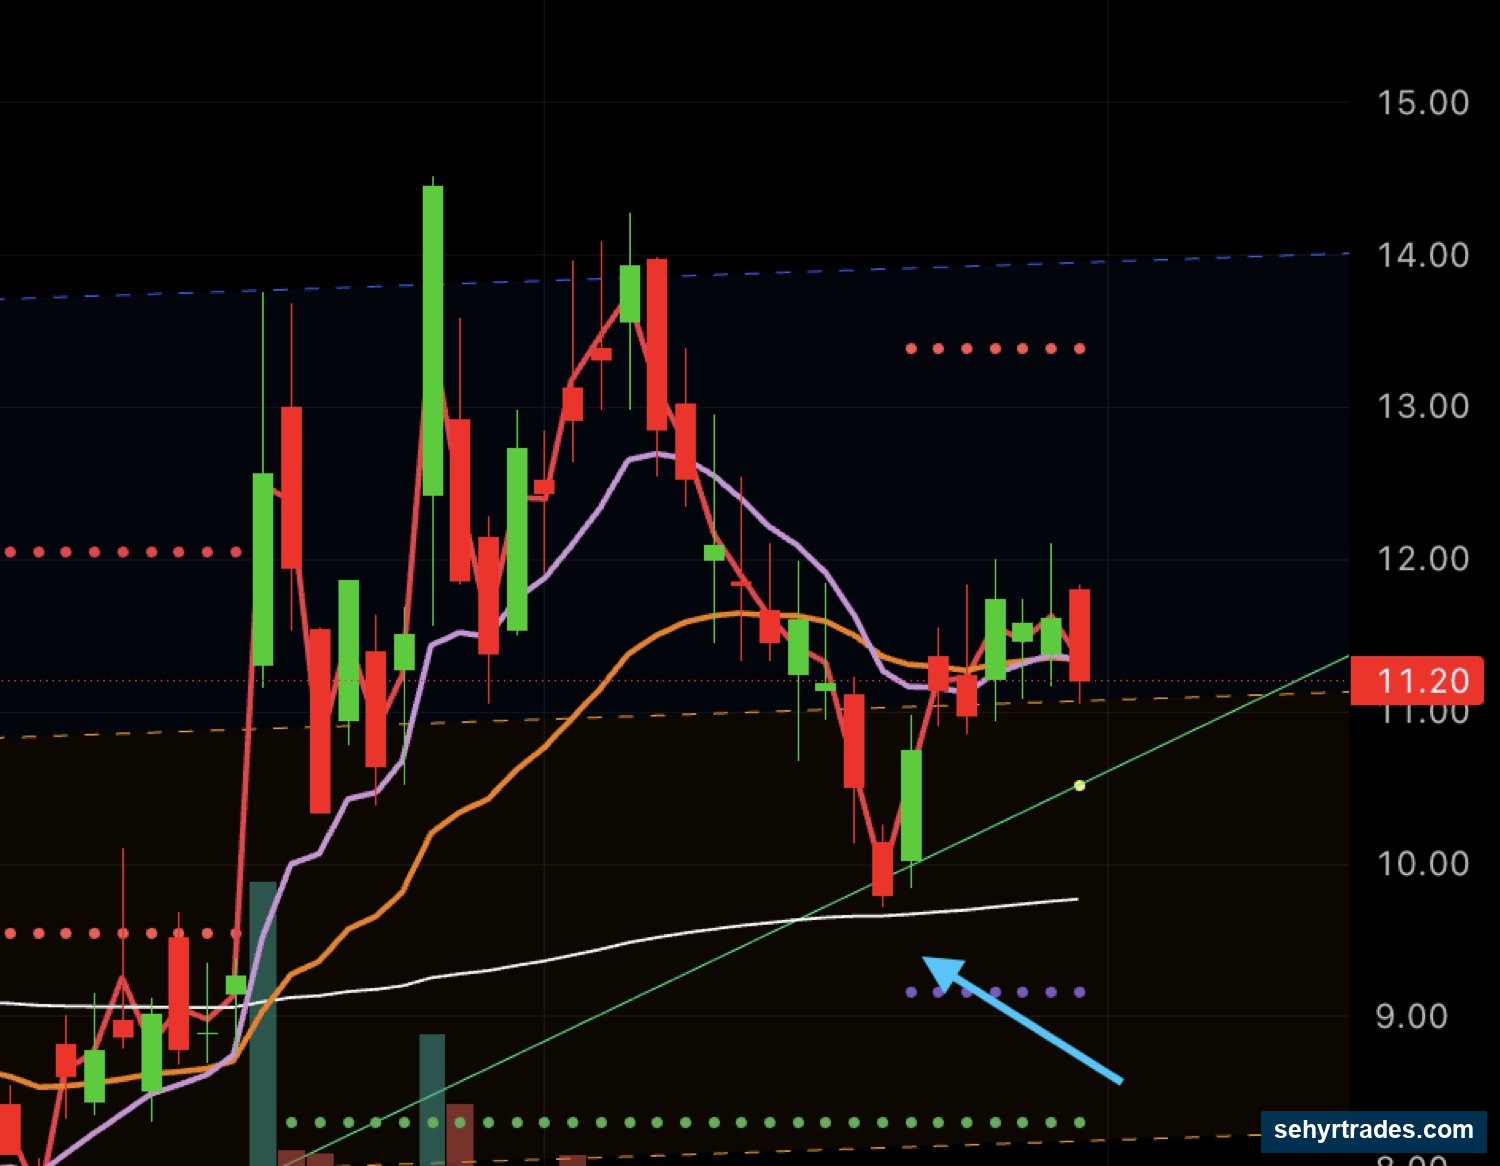
Here is another example on CRML, where you can see a clean bounce off the 200 EMA.
SETUP #4: REVERSAL
WHAT IT IS
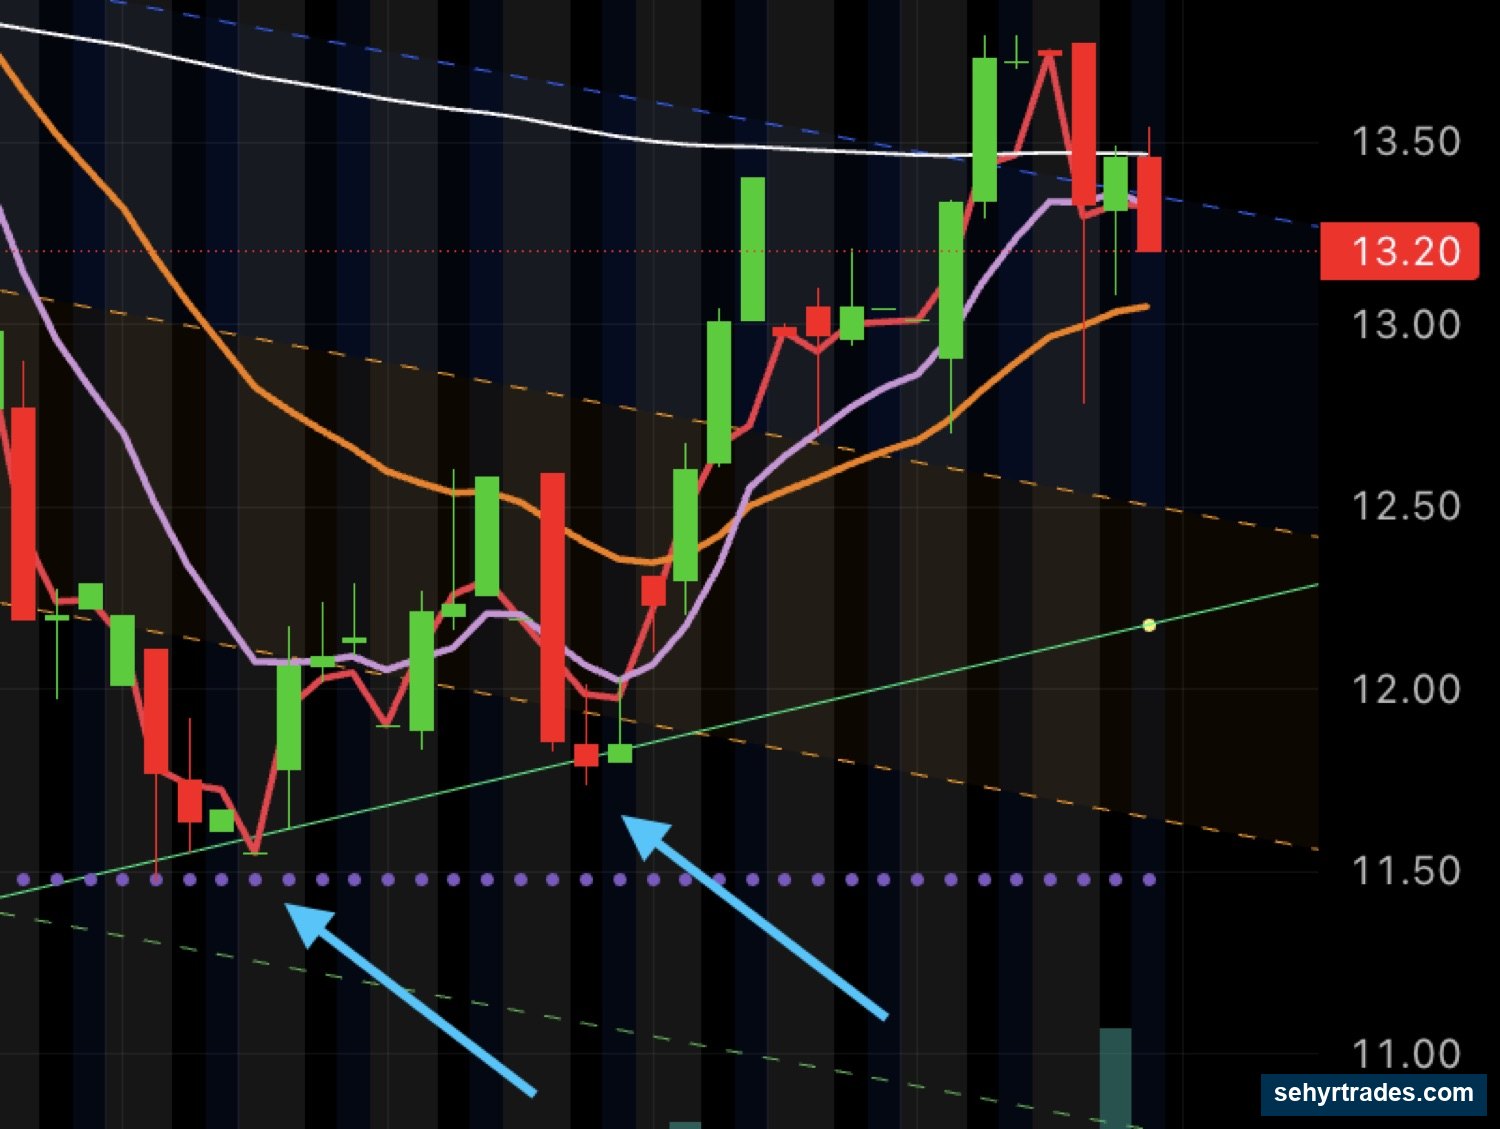
A trendline bounce against the prior trend, with follow-through. Sometimes these may coincide with another swing type, for example in the CRML chart above shows a bounce off the 200 EMA as well as the green trendline.
A downtrending stock hits a major trendline, support level, or oversold area and starts a real reversal — confirmed by structure breaking the downtrend.
This requires patience and confirmation. Most "reversals" fail. The ones that work need clean structure.
WHAT YOU SEE ON THE CHART
- Stock was downtrending
- Hits a major trendline or horizontal support
- Forms a higher low (first sign of reversal)
- Breaks the downtrend line with conviction
- Volume confirms
WHEN TO TAKE IT
- After the downtrend line breaks AND holds on a retest
- OR on a confirmed higher low + higher high pattern
- Volume rising on the up moves
STOP PLACEMENT
- Below the most recent higher low
- OR below the trendline that just broke
TARGETS
- T1 (1R) on initial reversal momentum
- T2 (2R) if reversal builds into a new trend
- Often these turn into trend trades if the reversal holds
COMMON MISTAKES
- Entering before the downtrend line shows an actual reversal confirmation
- Calling every bounce a "reversal" (most are just retracements)
- Ignoring the higher timeframe — if Daily is still strongly down, your 4H reversal may fail
Here is an example on IE where you can see the retest of the trendline (green line) before a nice move up. One thing to note is that the trendline constantly moves and repaints, so it is important to look for confirmation of reversal not just a simple touch of the trendline. (In the example you can see multiple bounces off the initial point of trendline touch).
SETUP #5: CHANNEL
WHAT IT IS
A stock trading in a defined range between support and resistance. We buy at support, sell at resistance.
This works when a stock is in a clear range without a strong trend. Lower reward than trend or pullback but very predictable when it works.
WHAT YOU SEE ON THE CHART
- Two clear levels (support below, resistance above)
- Multiple touches confirming both levels
- Price respecting both boundaries
- No major catalyst breaking the range
WHEN TO TAKE IT
- Price taps support and shows a bounce candle
- Volume confirms the bounce
- Resistance is clearly defined as your target
STOP PLACEMENT
- Below the channel support
- Tight stops because if support breaks, the channel is invalid
TARGETS
- T1 (1R) on first move off support
- T2 (2R) often lines up with the channel resistance
- Trim aggressively into resistance — channels can fail there
COMMON MISTAKES
- Chasing into the middle of the channel (no edge, no clear stop)
- Holding past resistance hoping for a breakout (often reverses)
- Trading a "channel" that's actually a downtrend with brief bounces
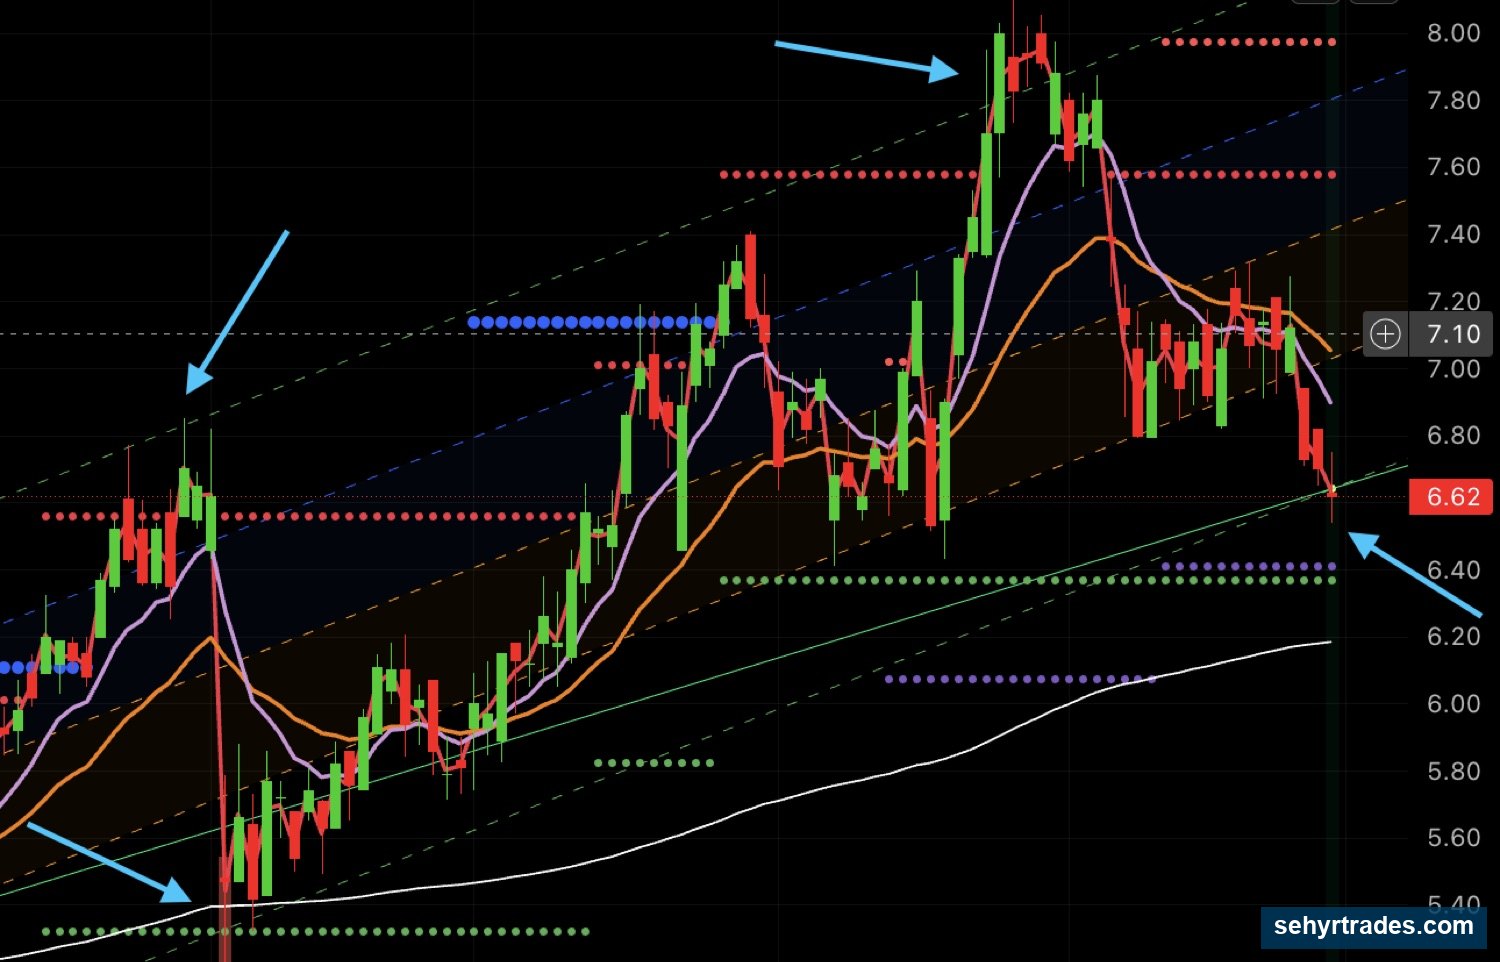
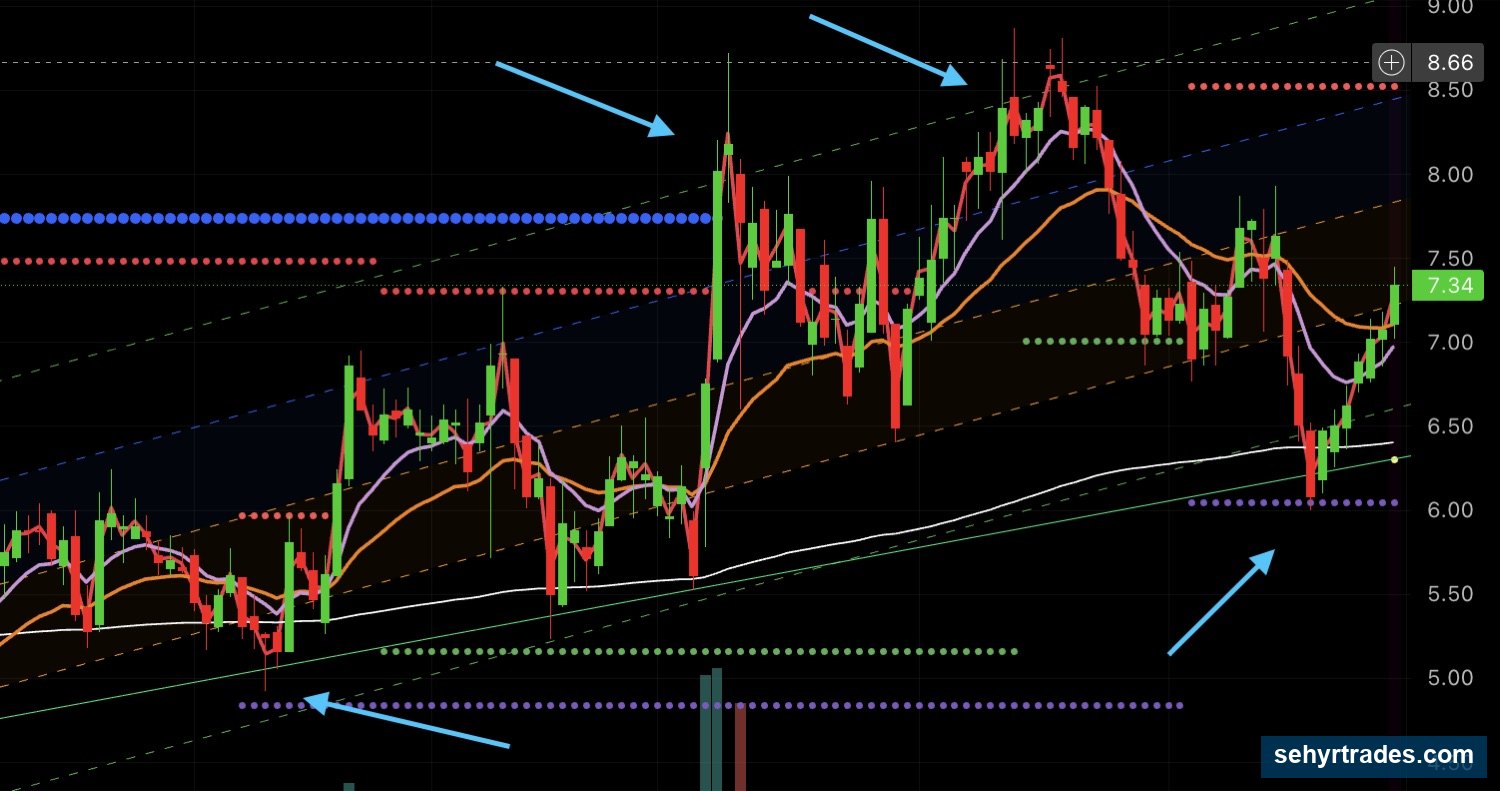
Here are a few examples, of both an uptrend chanel and a downtrend channel. The dashed lines you see are called standard deviation lines (you can learn more about them in #tradingview-template-and-indicators).
Note how in this chart of RES price respects the standard deviation levels and is trading neatly within a channel. You will often see this on many stocks and are able to more easily spot out support and resistance levels.
Here is another example on SLDB, where the chart is moving cleanly between the top dashed lines and the bottom.
SETUP #6: EXPANSION
WHAT IT IS
A breakout out of tight consolidation, with rising 9 EMA slope confirming the move. These are often explosive moves.
After a stock has compressed (tight range, decreasing volatility), it expands — breaking out with volume and momentum.
These can produce some of the biggest moves because the energy has built up during consolidation.
WHAT YOU SEE ON THE CHART
- Tight consolidation range over several days
- Decreasing volatility (smaller candles, tighter range)
- 9 EMA flattening then starting to slope up
- Volume picking up on the breakout candle
- Clean break above resistance with conviction
WHEN TO TAKE IT
- On the actual breakout candle with strong volume
- OR on a quick retest of the breakout level that holds
STOP PLACEMENT
- Below the breakout level
- OR below the top of the consolidation range
- Generally wider than other setups because of breakout volatility
TARGETS
- T1 (1R) on first thrust
- T2 (2R) often easily reached because expansion moves run further
- Strong runners can pay well beyond T2
COMMON MISTAKES
- Entering before the breakout actually happens (anticipating)
- Buying a fake breakout (no volume = likely false)
- Skipping the retest entry and chasing extended price
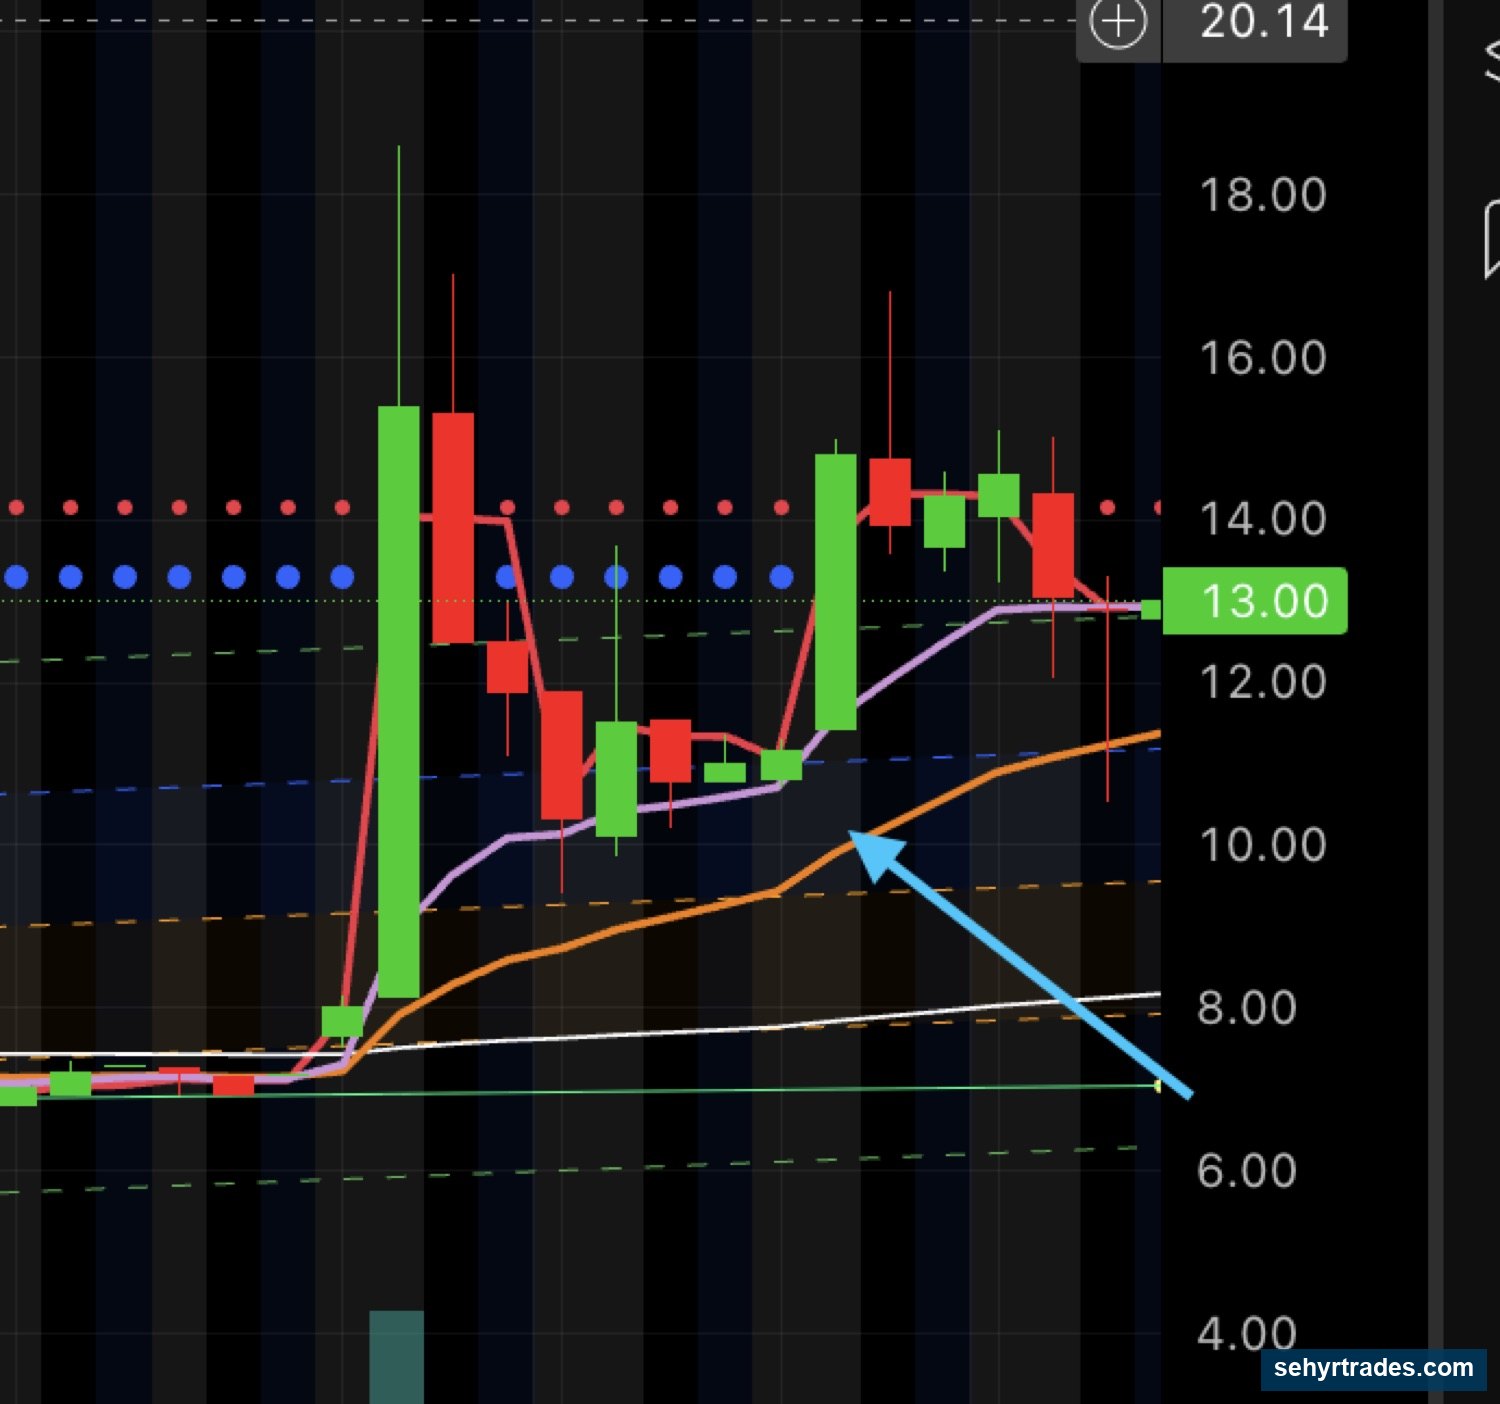
Here is a really good example on BRAI, note the compression right before the explosive move. These are typically found with recent runners that have an initial massive move, pullback and then consolidate and compress before making another huge move.
STOP LOSS & RISK MANAGEMENT
Every swing alert includes a defined stop loss based on chart structure.
Standard approach:
- Risk 1% of your account per trade (regardless of setup type)
- Stop is placed below structural invalidation (level breaks, swing low fails, etc.)
- Stop distance varies by setup — snap backs are tight, expansions are wider
POSITION SIZING (Risk-Based)
Step 1: Decide your risk
Risk 1% of your account per trade.
Examples:
- $5,000 account → risk = $50 per trade
- $10,000 account → risk = $100 per trade
Step 2: Identify your stop distance
The stop is defined in the alert based on the setup's structural invalidation.
T1 AND T2 (PROFIT TAKING)
Every swing alert includes T1 (1R target) and T2 (2R target).
T1 = 1R = your risk amount in profit
T2 = 2R = double your risk in profit
Example:
- Entry $10, Stop $9.50
- Risk per share = $0.50
- T1 = $10.50 (+1R)
- T2 = $11.00 (+2R)
STANDARD APPROACH
- Take partial profit at T1 (locks in your risk amount as profit)
- Move your stop UP to T1 once T1 hits (locks in at least +1R minimum)
- Hold the remainder toward T2
- For strong trend or expansion setups, runners past T2 are fine if structure holds
SETUP-SPECIFIC NOTES
⚡ Snap Back — Take most at T1, these reverse fast
📈 Trend / 🚀 Expansion — Let runners breathe, these can extend
📉 Pullback / 🔁 Reversal — Standard approach, scale at T1, hold for T2
📊 Channel — Trim aggressively into the channel resistance level, don't expect breakouts
This converts winning trades into "free" trades after T1 — worst case becomes +1R, not breakeven.
.
ADDING TO POSITIONS (DCA)
For swing trades, adding to winning positions is sometimes appropriate.
A good add looks like:
- Original idea still valid
- Stock is respecting structure (9/23 EMA, trendline, support)
- Pulled back and held → ready to continue
- You started with a starter position leaving room to add
A bad add looks like:
- Setup is breaking down
- Adding because you're emotional about being right
- Averaging down on a falling knife
- No structural reason — just hoping
(Full DCA framework: Risk & Execution Lesson 4)
Bot alerts are single-entry. DCA is your manual decision based on the chart's behavior after entry.
.
WHAT TO AVOID
- Entering before confirmation (anticipating the move)
- Skipping the setup type — every alert IS one of the 6 setups, treat it accordingly
- Sizing too big because you "feel sure" about a setup
- Ignoring overnight risk
- Holding through invalidation hoping it comes back
- Adding to losing positions
- Trading swing setups that conflict with the broader market (check SPY)
- Treating snap backs like trend trades (they need to be quick)
- Treating trend trades like snap backs (they need patience)
.
SWING TRADE CHECKLIST
Use this as a real-time pre-entry check:
☐ Setup type identified (one of the 6)?
☐ Higher timeframe (4H/Daily) supports the setup?
☐ Volume confirming the move?
☐ Structure clean (no chop, no choppy resistance directly above)?
☐ Stop loss defined at structural invalidation?
☐ Risk = 1% of account, no more?
☐ Position size calculated (not random share count)?
☐ T1 and T2 levels marked?
☐ Comfortable holding overnight?
If all yes → take the trade
If any no → wait or skip
Trade it with us.
Inside the room you get the live day and swing alerts with the exact entry, stop and targets, a daily watchlist, the halal scanners and the trade reviews.
Join premiumSehyr Trades is an educational community. Nothing here is financial advice, a recommendation, or a solicitation to buy or sell any security. Trading involves risk, including loss of capital. Always do your own research.